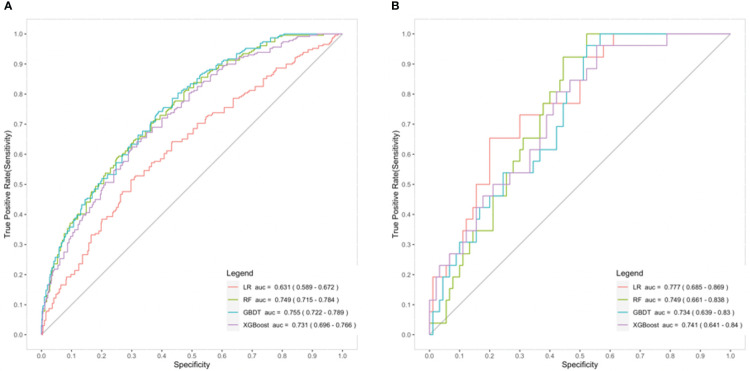
Figure 3.
Comparison of the prediction models for chronic postsurgical pain (CPSP) - receiver operating characteristic (ROC) curve in the training dataset (A) and the testing dataset (B). AUC, area under the curve; GBDT, gradient boosting decision tree (blue); LR, logistic regression (red); RF, random forest (green); XGBoost, extreme gradient boosting (purple).

