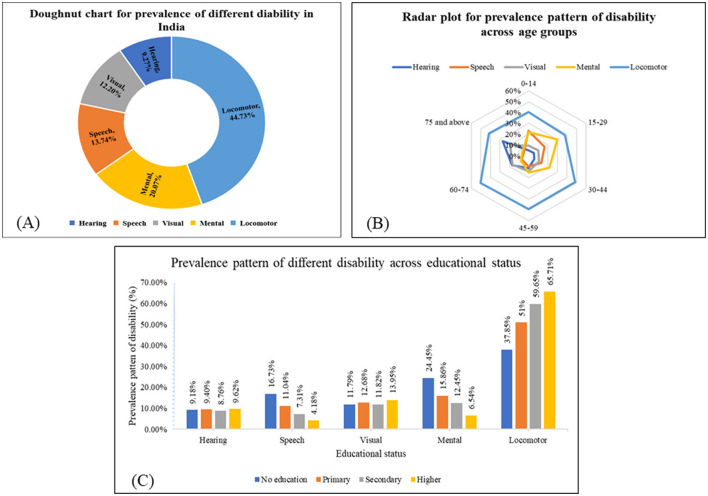
Figure 1.
Prevalence of different disabilities across sociodemographic characteristics. (A) Doughnut chart for the prevalence of different disabilities across the population in India based on NFHS-5 (N = 23,988). (B) Radar plot showing the prevalence pattern of different disabilities across age groups in India based on NFHS-5 (N = 23,988). (C) The prevalence pattern of different disabilities across educational statuses in India based on NFHS-5 (N = 23,988).

