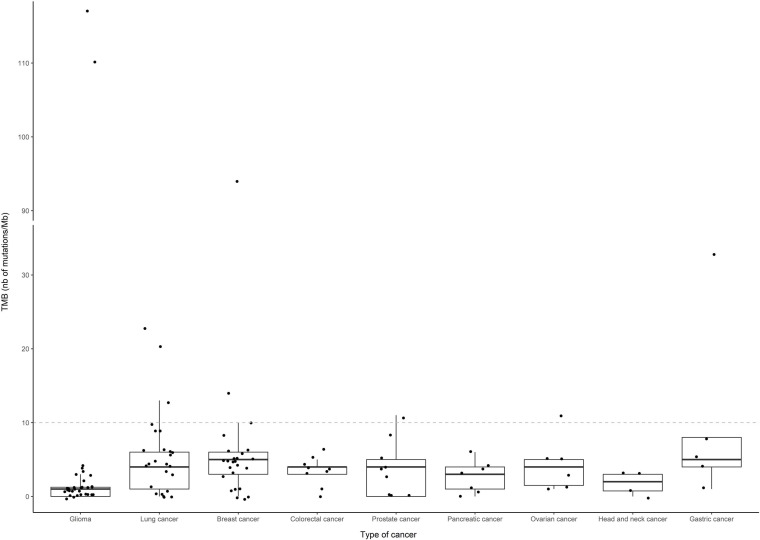
Figure 4.
Distribution of TMB (number of mutations per megabase) according to the type of cancer. Only tumor types with at least five cases with sequencing results were included in the representation, and are listed by decreasing number of patients: glioma (n=36), lung cancer (n=29), breast cancer (n=25), colorectal and prostate cancers (n=10), pancreatic cancer (n=9), ovarian cancer (n=7), head and neck cancer (n=6) and gastric cancer (n=5). Boxes indicate the median and quartile values, and points correspond to individual TMB values. A dashed grey line indicates the cutoff (10) for high and low TMB values.

