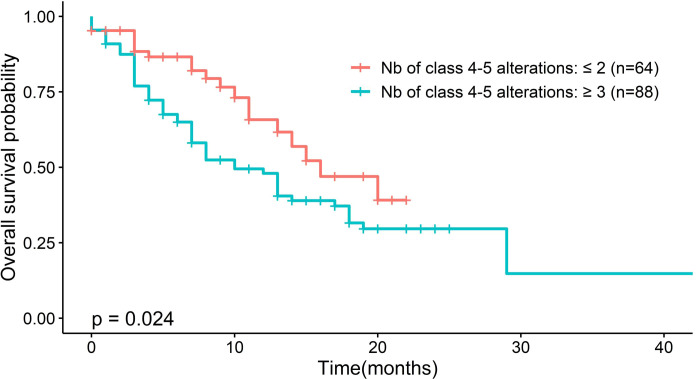
Figure 5.
Association between the frequency of class 4-5 gene alterations and survival rates. Kaplan-Meier curves are depicted according to low frequency of genetic alterations (none, one, or two altered genes per patient) versus high frequency (more than three altered genes per patient). P-values were determined by the log-rank test and used to compare two survival curves.

