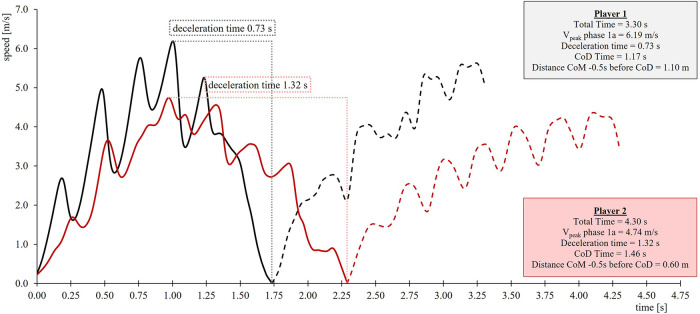
Figure 2.
Velocity-time data from the Tm505 for two players with different total times, peak velocities, deceleration and change of direction times, and distances of their CoM at a fixed time point (0.5s) prior to the CoD. Player 1 represents a male player from the post-PHV, and Player 2 is from the male pre-PHV group. Solid lines correspond to phase 1a, dashed lines phase 1b, dotted lines visualize the deceleration time from vpeak to the point of CoD.

