FIGURE 1.

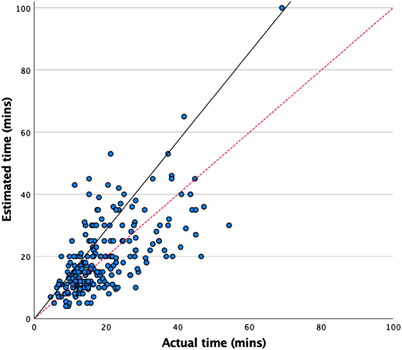
Scatterplot of the correlation between actual time taken and estimated time taken. *solid line shows actual correlation; dotted line shows reference line for perfect correlation.

Scatterplot of the correlation between actual time taken and estimated time taken. *solid line shows actual correlation; dotted line shows reference line for perfect correlation.