
FIGURE 1.
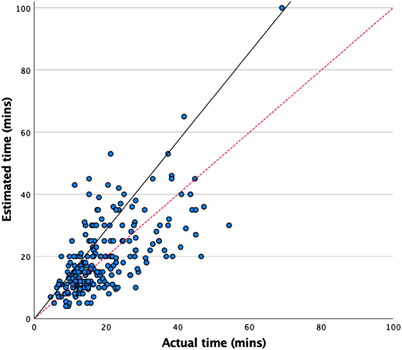
Scatterplot of the correlation between actual time taken and estimated time taken. *solid line shows actual correlation; dotted line shows reference line for perfect correlation.
Official websites use .gov
A
.gov website belongs to an official
government organization in the United States.
Secure .gov websites use HTTPS
A lock (
) or https:// means you've safely
connected to the .gov website. Share sensitive
information only on official, secure websites.
Scatterplot of the correlation between actual time taken and estimated time taken. *solid line shows actual correlation; dotted line shows reference line for perfect correlation.