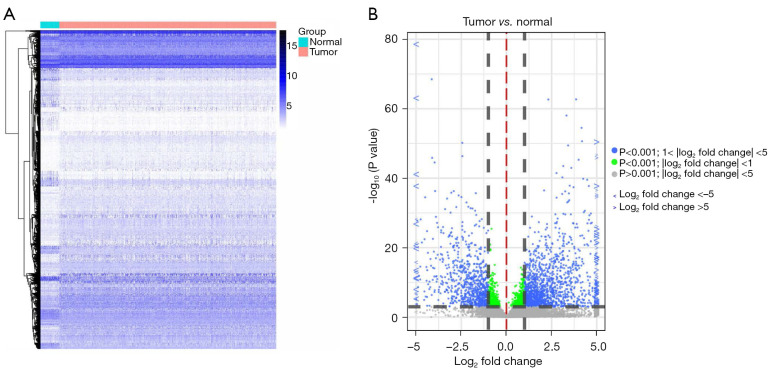
Figure 1.
Comparison of lncRNA expression profiles between HNSCC tumor samples and normal samples. (A) Heatmap of differentially expressed lncRNA in normal and tumor tissue. Differentially expressed lncRNA are lncRNA show an adjusted P value ≤0.0001. Genes shown in red are upregulated and genes in blue are downregulated. (B) The significantly upregulated and downregulated lncRNA in HNSCC tumor samples and normal samples are shown in the volcano plot (log2 fold change >1.0, P<0.01). HNSCC, head and neck squamous cell carcinoma; lncRNA, long noncoding RNA.

