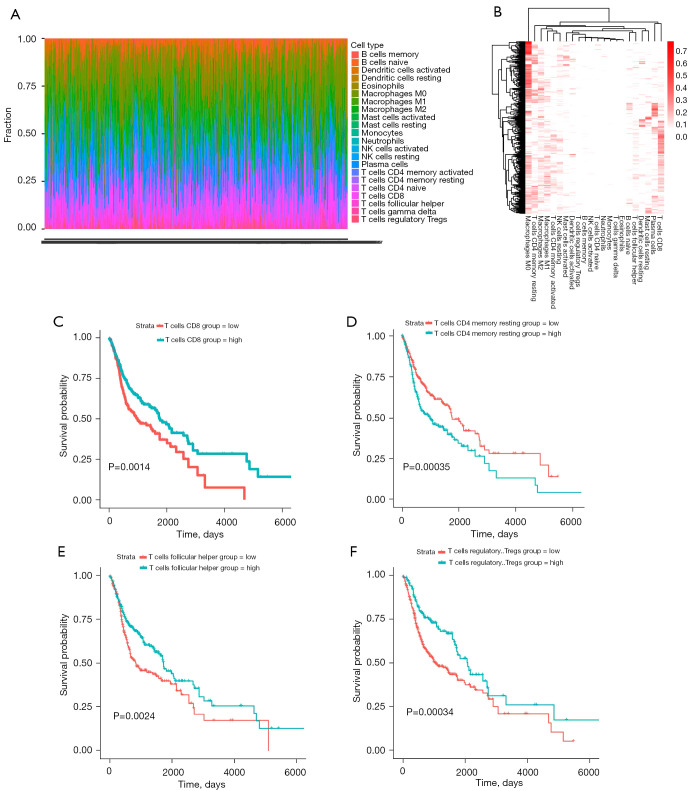
Figure 7.
The landscape of immune infiltration in HNSCC. (A) The difference of immune infiltration in HNSCC samples. (B) Heat map of the 22 immune cell fractions in TCGA-HNSCC cohort. The vertical axis depicts the clustering data of samples which were divided into two discrete groups. (C) Survival plot of median of CD8 T cells. (D) Survival plot of median of CD4+ memory T cells. (E) Survival plot of median of follicular helper T cells. (F) Survival plot of median of regulatory T cells. The P values are from log-rank tests. HNSCC, head and neck squamous cell carcinoma; TCGA, The Cancer Genome Atlas.

