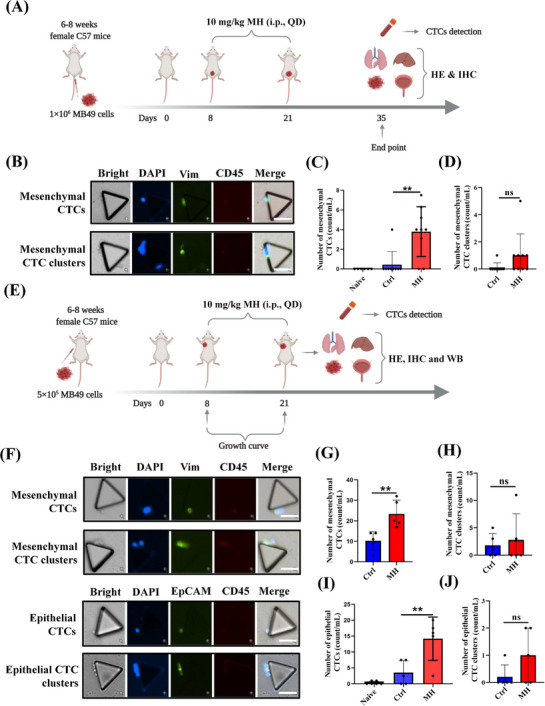
FIGURE 2.

MORA treatment increases generation of mesenchymal and epithelial CTCs in murine BC models, (A) Study diagram: MB49 cells were injected into mouse bladders to establish BC in situ BC. 10 mg/kg of MH or normal saline was injected intraperitoneally daily for 14 days (Days 8‐21), (B‐D) Representative images of mesenchymal CTCs and CTC clusters detected by microfluidic chip in mice with in situ BC (B). The number of mesenchymal CTCs (C) and mesenchymal CTC clusters (D) were increased in the MH group. The former reached statistical significance, the latter showed a trend (B‐D: n = 6 for naïve, n = 9 each in the Ctrl and MH groups, mean ± SD, scale bar = 50 μm), (E) Study diagram: MB49 cells were injected subcutaneously into the right upper “arm” pit of mice to establish a subcutaneous BC model. 10 mg/kg of MH or normal saline were injected intraperitoneally daily for 14 days (Days 8‐21), (F‐J) Representative images of mesenchymal CTCs and CTC clusters, and epithelial CTCs and CTC clusters, detected by microfluidic chip in mice with subcutaneous BC (F). Quantification of mesenchymal CTCs (G), mesenchymal CTC clusters (H), epithelial CTCs (I), and epithelial CTC clusters (J) in mice with subcutaneous BC. (F‐J: n = 6 for naïve, n = 5 each in the Ctrl and MH groups, mean ± SD, scale bar = 50 μm). **P < 0.01; ns, not significant. naïve, no tumor cell injection and no vehicle treatment, Abbreviations: MORA, μ‐opioid receptor agonist; CTC, circulating tumor cell; BC, bladder cancer; MH, morphine hydrochloride; Ctrl, normal saline controls; QD, once a day; HE, hematoxylin and eosin; IHC, immunohistochemistry; WB, western blot; SD, standard deviation.
