
FIGURE 4.
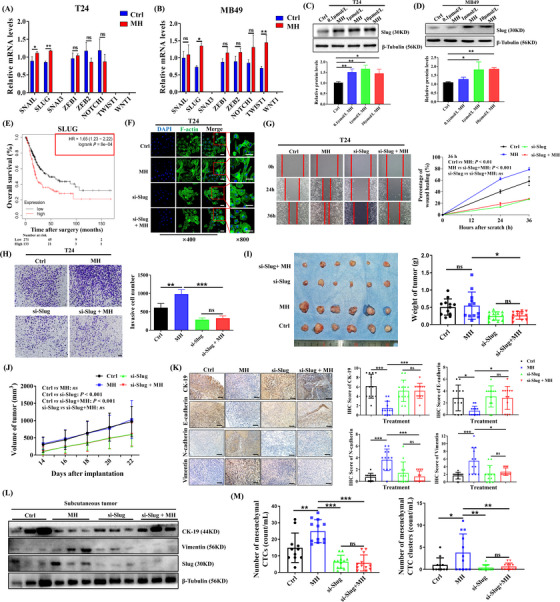
MORA promotes EMT in BC cells by upregulating the EMT‐TF Slug, (A‐B) mRNA expression patterns of eight EMT‐TFs in MH‐treated T24 cells (A) and MB49 cells (B). (A‐B, n = 3 per group; mean ± SD). Expression levels of SNAI3, TWIST1 and WNT1 were below level of detection in T24 cells. Expression levels of SNAI3 and WNT1 were below level of detection in MB49 cells, (C‐D) Western blots showing a significant upregulation of Slug protein expression in T24 (C) and MB49 cells (D) after MH treatment (C‐D, n = 3 per group; mean ± SD), (E) Kaplan‐Meier analysis from the TCGA‐BC dataset, examining the correlation between SLUG expression levels and overall BC patient survival, showing that higher SLUG levels were significantly associated with shorter overall patient survival, (F‐H) Slug knockdown in T24 cells significantly reversed MH‐induced morphological changes (F), increases in migrative (G), and increases in invasive abilities (H). (F‐H, n = 3 per group; mean ± SD, scale bar = 100 μm in left three panels of F and in G and H), (I‐J) Tumor growth was significantly inhibited in Slug‐deficient MB49 cell tumors, with or without MH treatment, (K) IHC staining showing inhibition of the morphine‐induced EMT process in Slug knockdown tumors (scale bar = 100 μm), (L) Western Blots of subcutaneous BC tumors showing reversal of MH‐induced changes of EMT markers when Slug was knocked down, (M) The mesenchymal CTC and CTC cluster increase seen in the MH‐treated group was significantly reduced in the absence of Slug. (n = 12 per group for I‐L, and n = 11‐12 per group for M) All data was shown as mean ± SD. *P < 0.05, **P < 0.01, ***P < 0.001; ns, not significant, Abbreviations: MORA, μ‐opioid receptor agonist; EMT, epithelial‐mesenchymal transition; BC, bladder cancer; TF, transcription factor; MH, morphine hydrochloride; Ctrl, control; SD, standard deviation; IHC, immunohistochemistry; CTC, circulating tumor cell.