
Fig.1: EGFP-L10a expression and differences in ribosome-associated mRNA expression in the PFC and striatum of D1-TRAP mice.
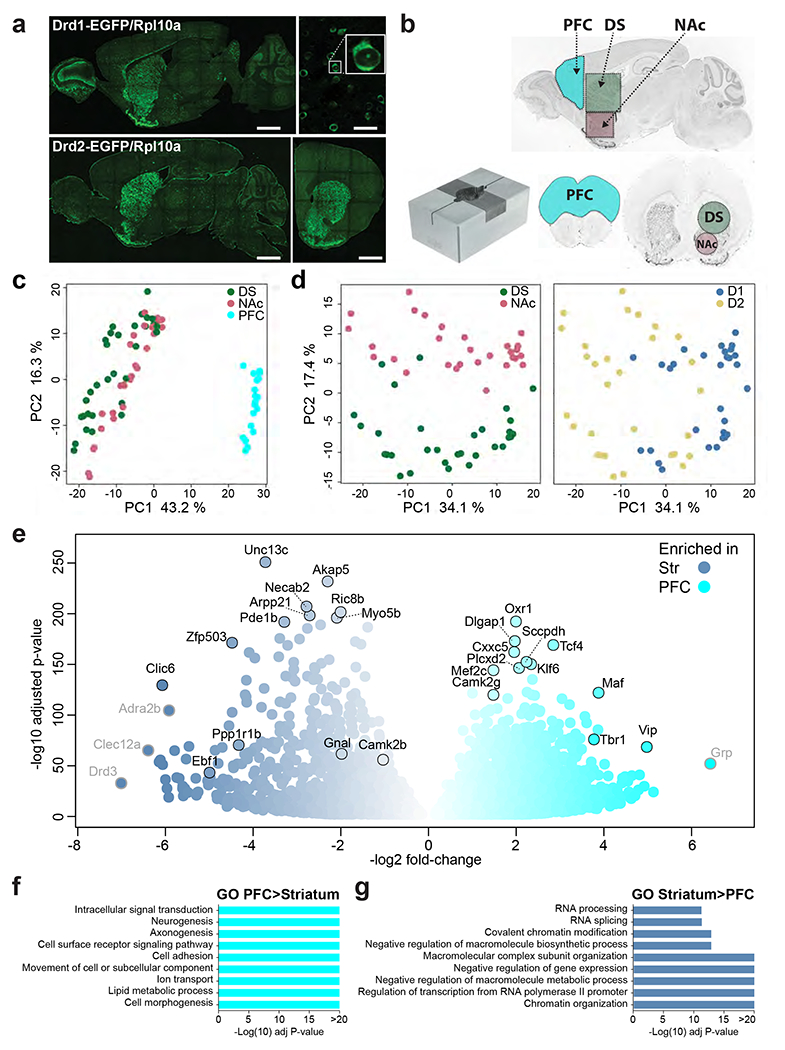
a. Brain sections from representative TRAP mice showing the location of the cells expressing EGFP-L10a (direct EGFP fluorescence). Upper panel, D1-TRAP mouse, left picture sagittal section (scale bar 1.5 mm), right picture higher magnification of the striatum (scale bar 50 μm) and blow up of a single neuron illustrating cytoplasmic and nucleolar labeling. Lower panel, D2-TRAP mouse, left picture, sagittal section, right picture, coronal section through the striatum (scale bars 1.5 mm). Images are stitched confocal sections. b. Collection of brain tissue samples. Brains were rapidly dissected and placed in a stainless steel matrix (lower left panel) with 0.5 mm coronal section interval, and two thick slices containing the PFC (cyan, 2 mm-thick) and the striatum (3 mm-thick) were obtained. The PFC was cut, and the dorsal striatum (DS, green) and the nucleus accumbens (NAc, light red) were punched out with a metal cannula on ice. Limits of the tissue samples are indicated on sagittal (left panel) and coronal (right panel) sections. c. PCA of RNAseq gene expression assessed in TRAP-purified mRNAs from PFC, DS and NAc of D1- or D2-TRAP mice. Each point corresponds to a sample of tissues from 1-3 mice. d. PCA of RNAseq from the DS and NAc of D1- and D2-TRAP mice. The same plot was differentially colored for DS and NAc samples (left panel) or D1 and D2 samples (right panel). e. Volcano plot showing differential mRNA expression between striatal D1 samples (blue) and D1 samples from PFC (cyan). Names of some top representative mRNAs are indicated (those with low expression levels are in grey). f-g. Main gene ontology (GO) pathways for genes more expressed in PFC than in striatum (f) or more expressed in striatum than in PFC (g). Only the most significant non-redundant pathways are shown. For complete results, see Supplementary Tables 3g, h.