
Fig.2: Differential ribosome-associated mRNA expression in striatal regions of D1- and D2-TRAP mice.
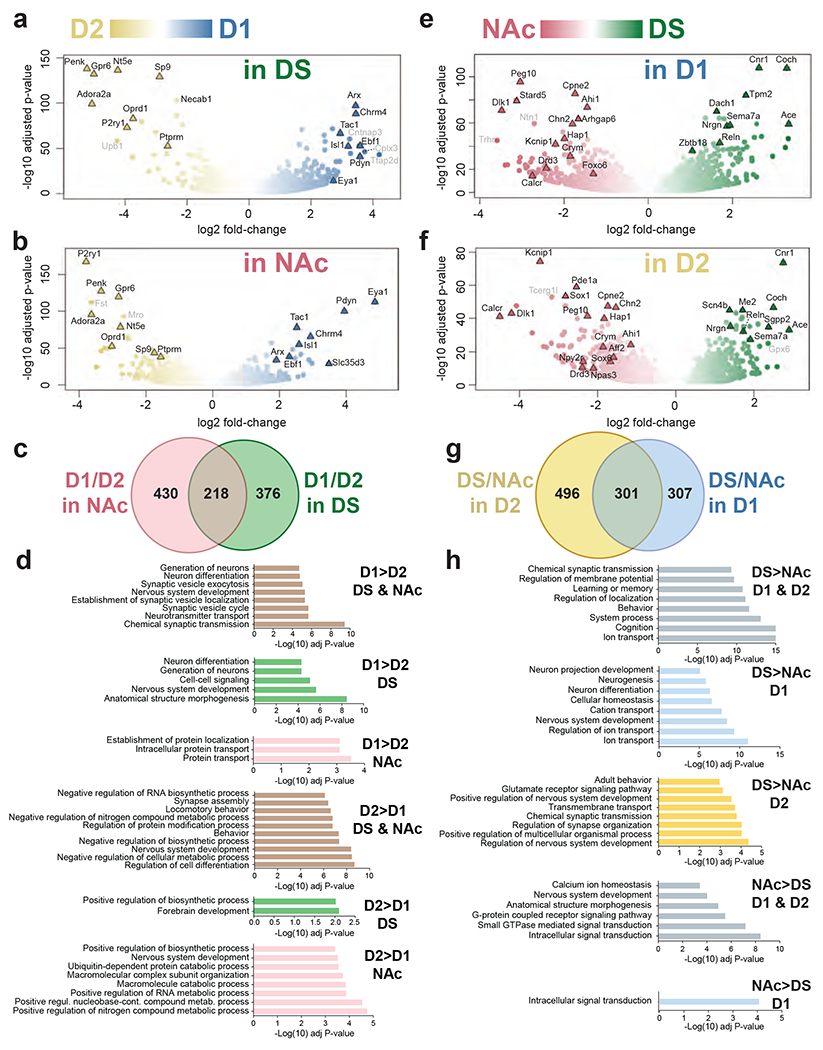
mRNA was purified by BAC-TRAP from the DS and NAc of D1- or D2-TRAP mice and analyzed by RNAseq. a-b. Volcano plots of the differences in expression patterns between D1 (blue) and D2 (yellow) samples in the DS (a) or the NAc (b). c. Venn diagram of data in a and b showing the number of mRNAs differentially expressed in D1 vs. D2 samples in the NAc (light red) and DS (green). d. Main gene ontology (GO) pathways for genes more expressed in D1 or in D2 neurons in DS, NAc or both, as indicated. Only the most significant non-redundant pathways are shown. For complete results, see Supplementary Tables 7a–f. e, f. Volcano plot of the differences between DS (green) and NAc (red) in D1 (e) and D2 (f) samples. g. Venn diagram of the data in e and f showing the number of mRNAs differentially expressed in DS vs. NAc samples in the D1 (blue) and D2 (yellow) samples. h. Main gene ontology (GO) pathways for genes more expressed in DS or in NAc neurons in D1, D2, or both, as indicated. Only the most significant non-redundant pathways are shown (complete results in Supplementary Tables 12a–f). In a, b, e, and f, the names of top representative mRNAs are indicated (those with low expression levels are in grey). In a-c and e-g thresholds were Padj < 10−3, fold-change > 2 and mean baseMean ≥ 10.