Figure 1.
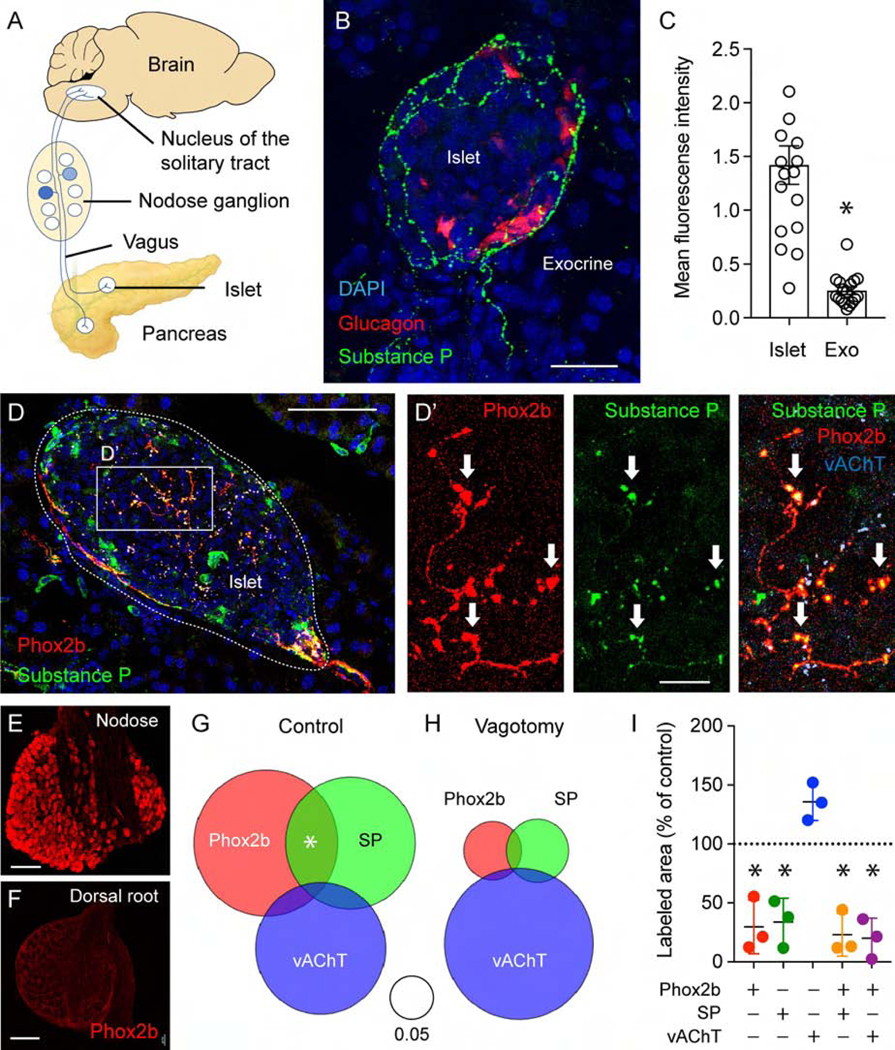
Mouse pancreatic islets are innervated by vagal sensory fibers. (A) Cartoon of the vagal islet-brain axis. (B) Mouse pancreas section showing the innervation pattern of substance P(SP)-positive sensory axons (green) in an islet, alpha cells labeled for glucagon (red). Shown are z-stacks of confocal images. (C) Quantification of the mean fluorescence intensity of SP immunostaining in the islet and the surrounding exocrine tissue (n = 18 mice, 3–7 islets per animal; mean +/− SEM, unpaired Student’s t-test; for data showing innervation densities in mice of different genders and strains, see Supplementary Figure 1). (D-D’) Pancreatic section from a Phox2b-Cre-tdTomatofloxed transgenic mouse, immunostained for RFP (red), SP (green), and vAChT (light blue), Dapi (dark blue). Arrows point at colocalization of Phox2b with SP. (E-F) Sections of the nodose (E) and thoracic dorsal root ganglia (F) from a Phox2b-Cre-tdTomatofloxed transgenic mouse, immunostained for RFP (red). (G-I) Quantification of immunostaining of pancreatic innervation (as in D). Staining areas for each neuronal marker and their overlap were normalized to the corresponding islet area (control n = 4 mice, vagotomy n = 3 mice, 28 islets in each group). Venn diagrams depict sums of the normalized area values. (I) Means of neuronal staining areas for mice of the vagotomy group, shown as percentage of the average area of the control population (mean +/− SEM, one sample t-test comparison to a hypothetical value of 100). Scale bars, (B) 20 μm, (D) 50 μm, (D’) 10 μm, and (E, F) 100 μm.

