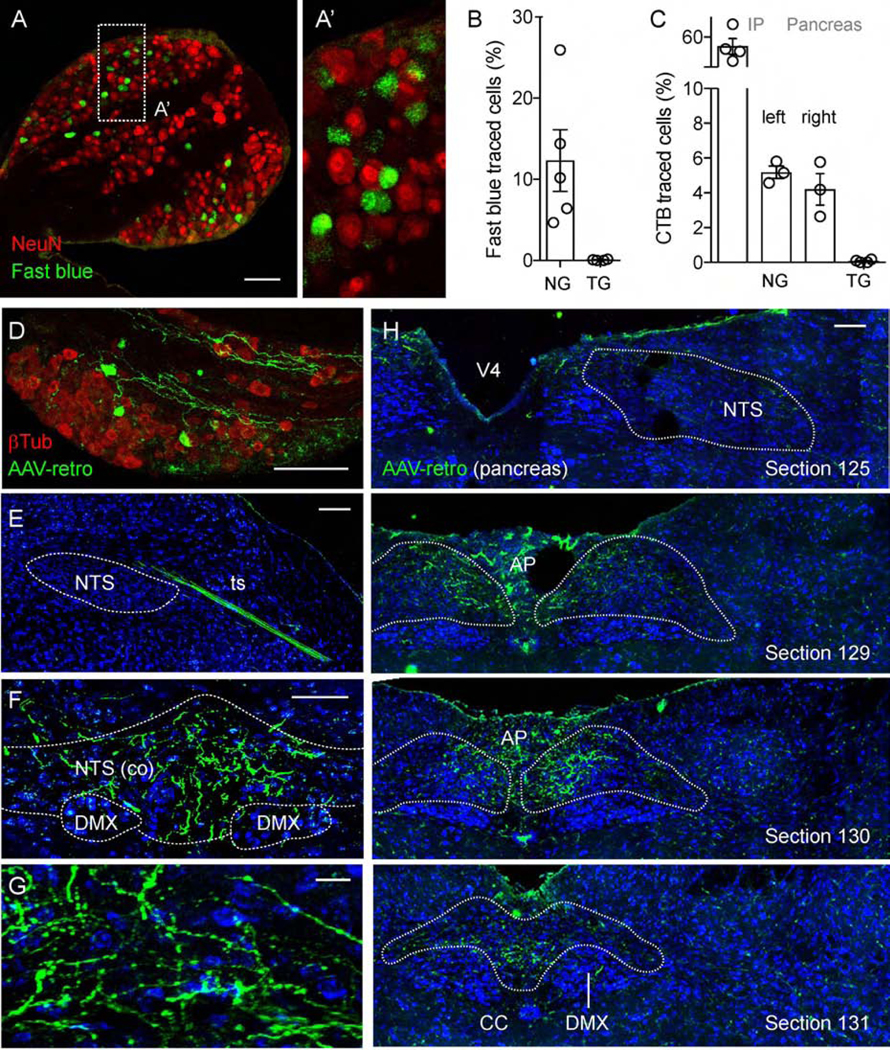
Figure 2.
Pancreatic vagal afferents projections to the nucleus of the solitary tract (NTS). (A-A’) Section of a mouse nodose ganglion showing retrogradely traced neurons (green), one week after intraductal pancreas infusion of the neuronal tracer fast blue. NeuN (red) visualizes all neurons. (B) Quantification of data as in A showing the percentage of neurons traced with Fast Blue in the left nodose ganglion (1034/8275 neurons) and trigeminal ganglion (0/5000 neurons, negative control); (n = 5 mice, 5–9 sections per ganglion). (C) Quantification of the percentage of neurons traced with cholera toxin B (CTB) in the left nodose ganglion after IP injection of the tracer (2252/4000 neurons, positive control); the left (348/6761 neurons) and right (178/4818 neurons) nodose ganglia and trigeminal ganglion (2/4000 neurons, negative control) after intraductal pancreas infusion of CTB (n = 3–4 mice, 5–9 sections per ganglion). (D-H) Mouse nodose ganglion (D) and brainstem sections (E-H) showing traced neurons and central terminals (green) 4 weeks after intraductal pancreas infusion of the neuronal tracer AAV-retro. β−Tubulin staining (red) visualizes all nodose neurons (D). Cytoarchitectural boundaries in E-H were identified with Nissl stain (blue, representative of 5 animals). A rostral brainstem section shows a traced neuronal bundle in the tractus solitarius (ts), not terminating in the rostral NTS (E). Sections at the level of the caudal commissural NTS contain terminal fields of neurons traced from the pancreas (F-G). Images of mouse brainstem sections from rostral to caudal are shown in H (section numbers correspond to those of the Allen reference atlas). Scale bars, (all but G) 100 μm and (G) 10 μm.

