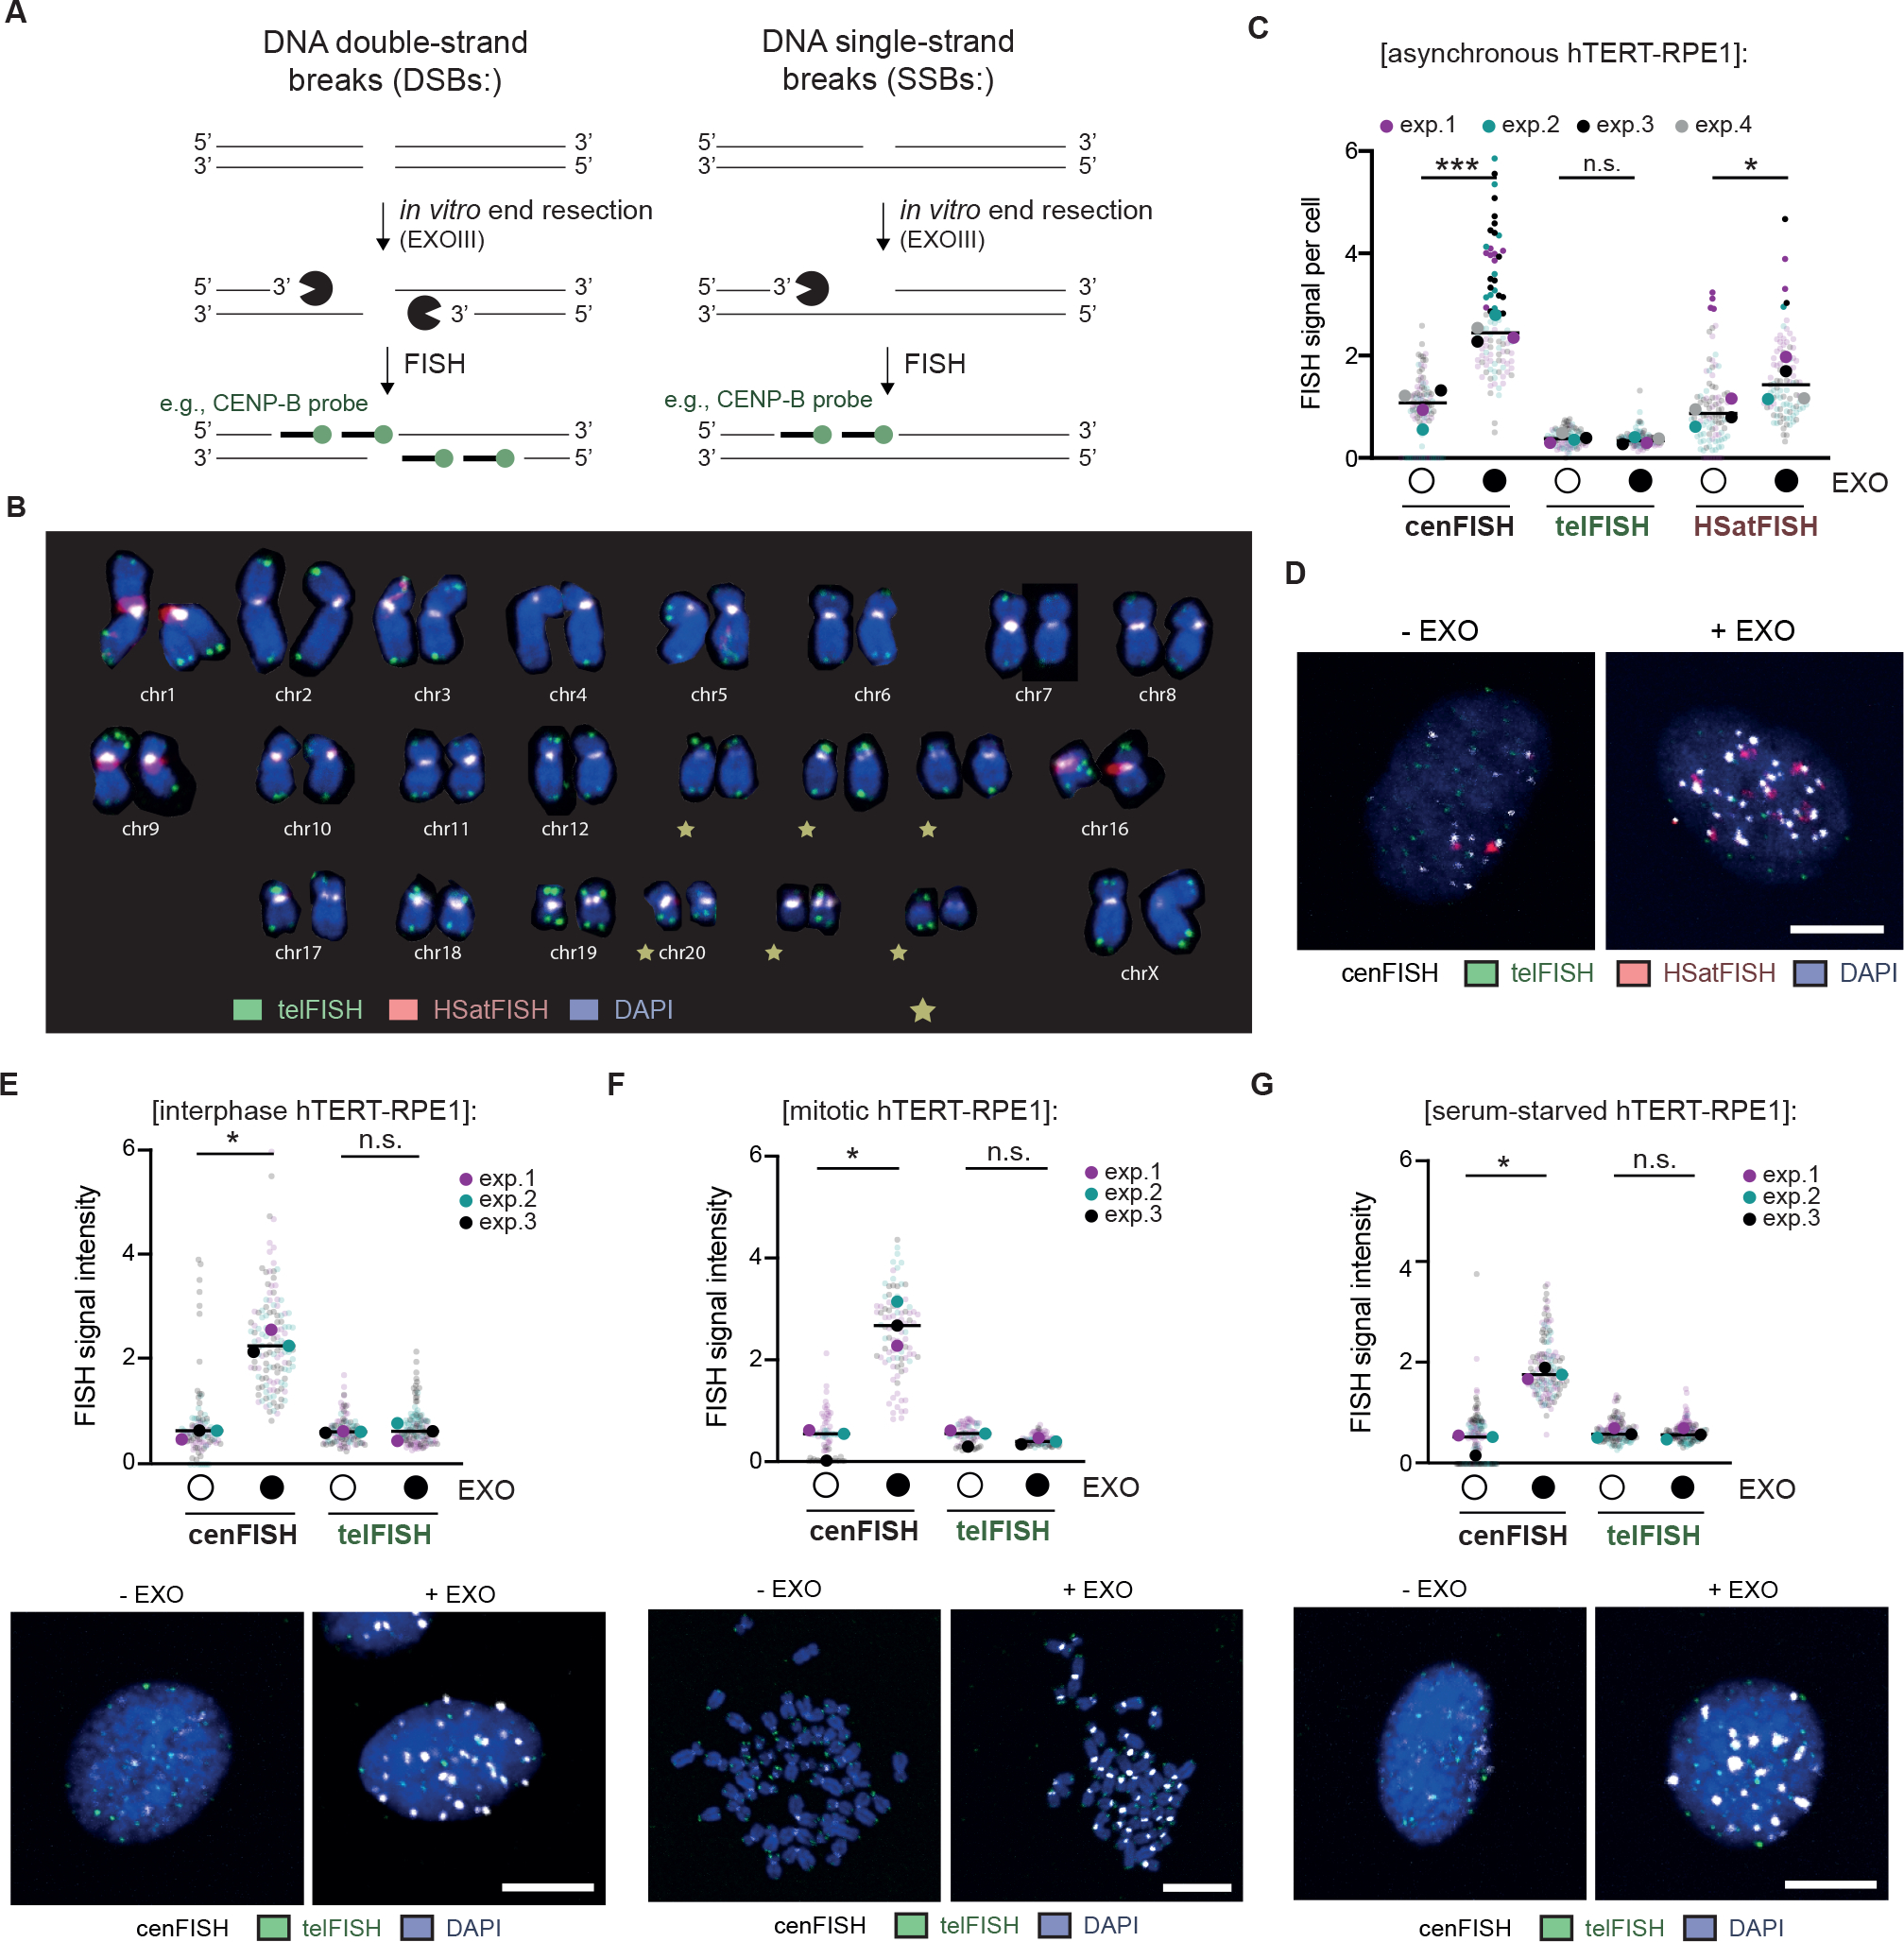
Figure 2 |. Detection of spontaneous centromere HOR breaks with exo-FISH.

(A) Schematic of the detection of DNA breaks at repetitive elements using exo-FISH. (B) Karyogram depicting FISH probe hybridization patterns. FISH probes against HOR-associated centromere repeats (cenFISH, white), telomere repeats (telFISH, green) and human satellites 2 and 3 (HSatFISH, red) are depicted. (C, D) Quantification and representative images of exo-FISH applied to asynchronous hTERT-RPE1 cells with and without Exonuclease III (EXO) treatment. FISH signal intensity was calculated by first taking the sum of the fluorescence signal surrounding each cenFISH, telFISH or HSatFISH focus in a 14×14–20×20 pixel box, following a perimeter-estimated background subtraction. The median value for each cell is then calculated and plotted above, with each data point representing a cell median. (E) Representative images and quantification of exo-FISH in interphase hTERT-RPE1 cells. (F) Representative images and quantification of exo-FISH in mitotic hTERT-RPE1 cells. Cells were arrested in mitosis with a 3–5-hour STLC treatment and harvested by mitotic shake-off prior to spreading. (G) Representative images and quantification of exo-FISH in quiescent (i.e., serum-starved hTERT-RPE1) cells. Cells were serum-starved for ~120 hours before harvesting. Scale bar represents 10 μm. FISH signal intensity is X10,000 arbitrary units (A.U.). At least 30 cells were imaged per experimental condition. The medians of each experimental condition were used to perform a two-sided unpaired t-test (*p<0.05, **p<0.01). Filled and empty circles indicate presence and absence, respectively. See also Figure S3.
