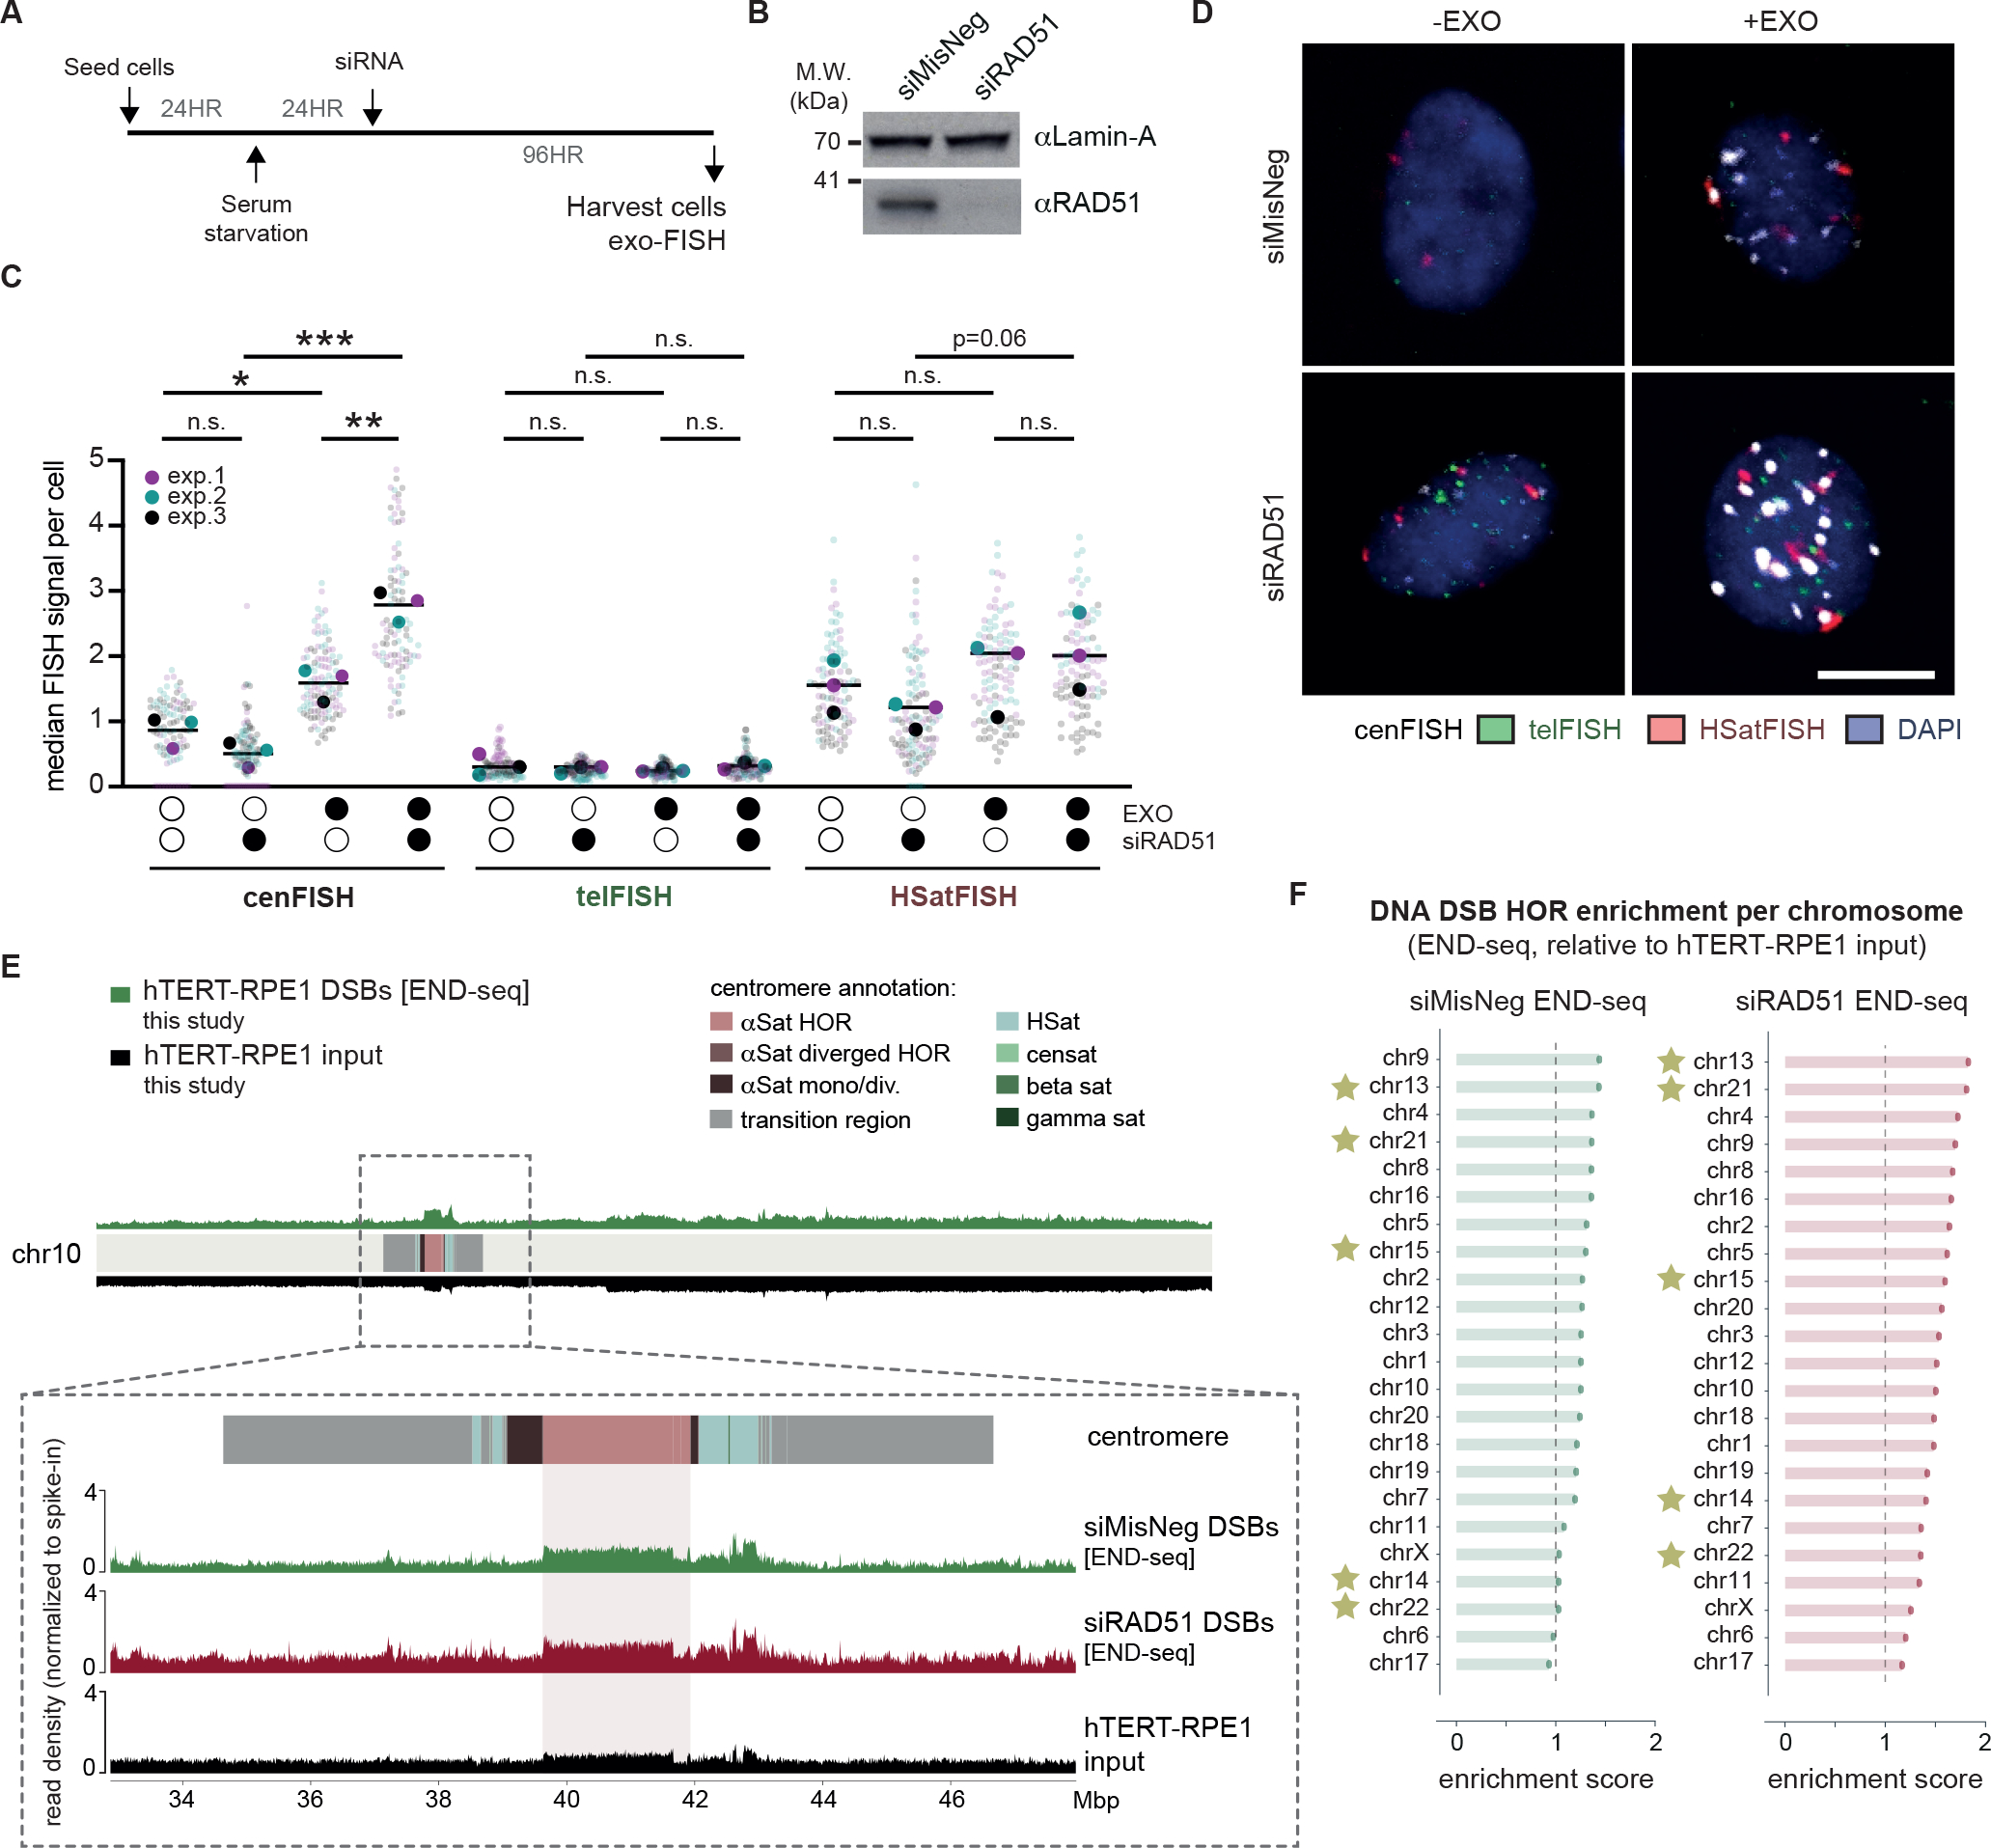
Figure 5 |. The recombinase RAD51 prevents the accumulation of centromere HOR DNA DSBs during quiescence.

(A) Experimental schematic for the detection of centromeric breaks upon RAD51 depletion in quiescent hTERT-RPE1 cells. (B) Western blot confirming the depletion of RAD51 protein levels 72 hours after siRNA treatment. Lamin-A levels were used as a loading control. (C, D) Representative images and quantification of exo-FISH following RAD51 depletion. Quantification of FISH signals were performed as in Figure 2. Scale bar represents 10 μm. FISH signal intensity is X10,000 arbitrary units (A.U.). At least 30 cells were imaged per experimental condition. The averages of each experimental condition were used to perform a two-sided unpaired t-test (*p<0.05, **p<0.01). Filled and empty circles indicate presence and absence, respectively. (E) Inset of chr10 centromere depicting DNA DSBs (END-seq) following 96 hours depletion of RAD51 or the negative control in serum-starved hTERT-RPE1 cells. NGS alignment was performed with both PCR duplicate removal and spike-in normalisation. Baseline deviation of reads on the right arm of chr10 likely indicate some copy-number variation of hTERT-RPE1 relative to the T2T-CHM13 reference genome. (F) Enrichment END-seq scores across hTERT-RPE1 centromere HORs. NGS alignment was performed with both PCR duplicate removal and spike-in normalisation, and enrichment scores were quantified as in Figure 1. See also Figure S6.
