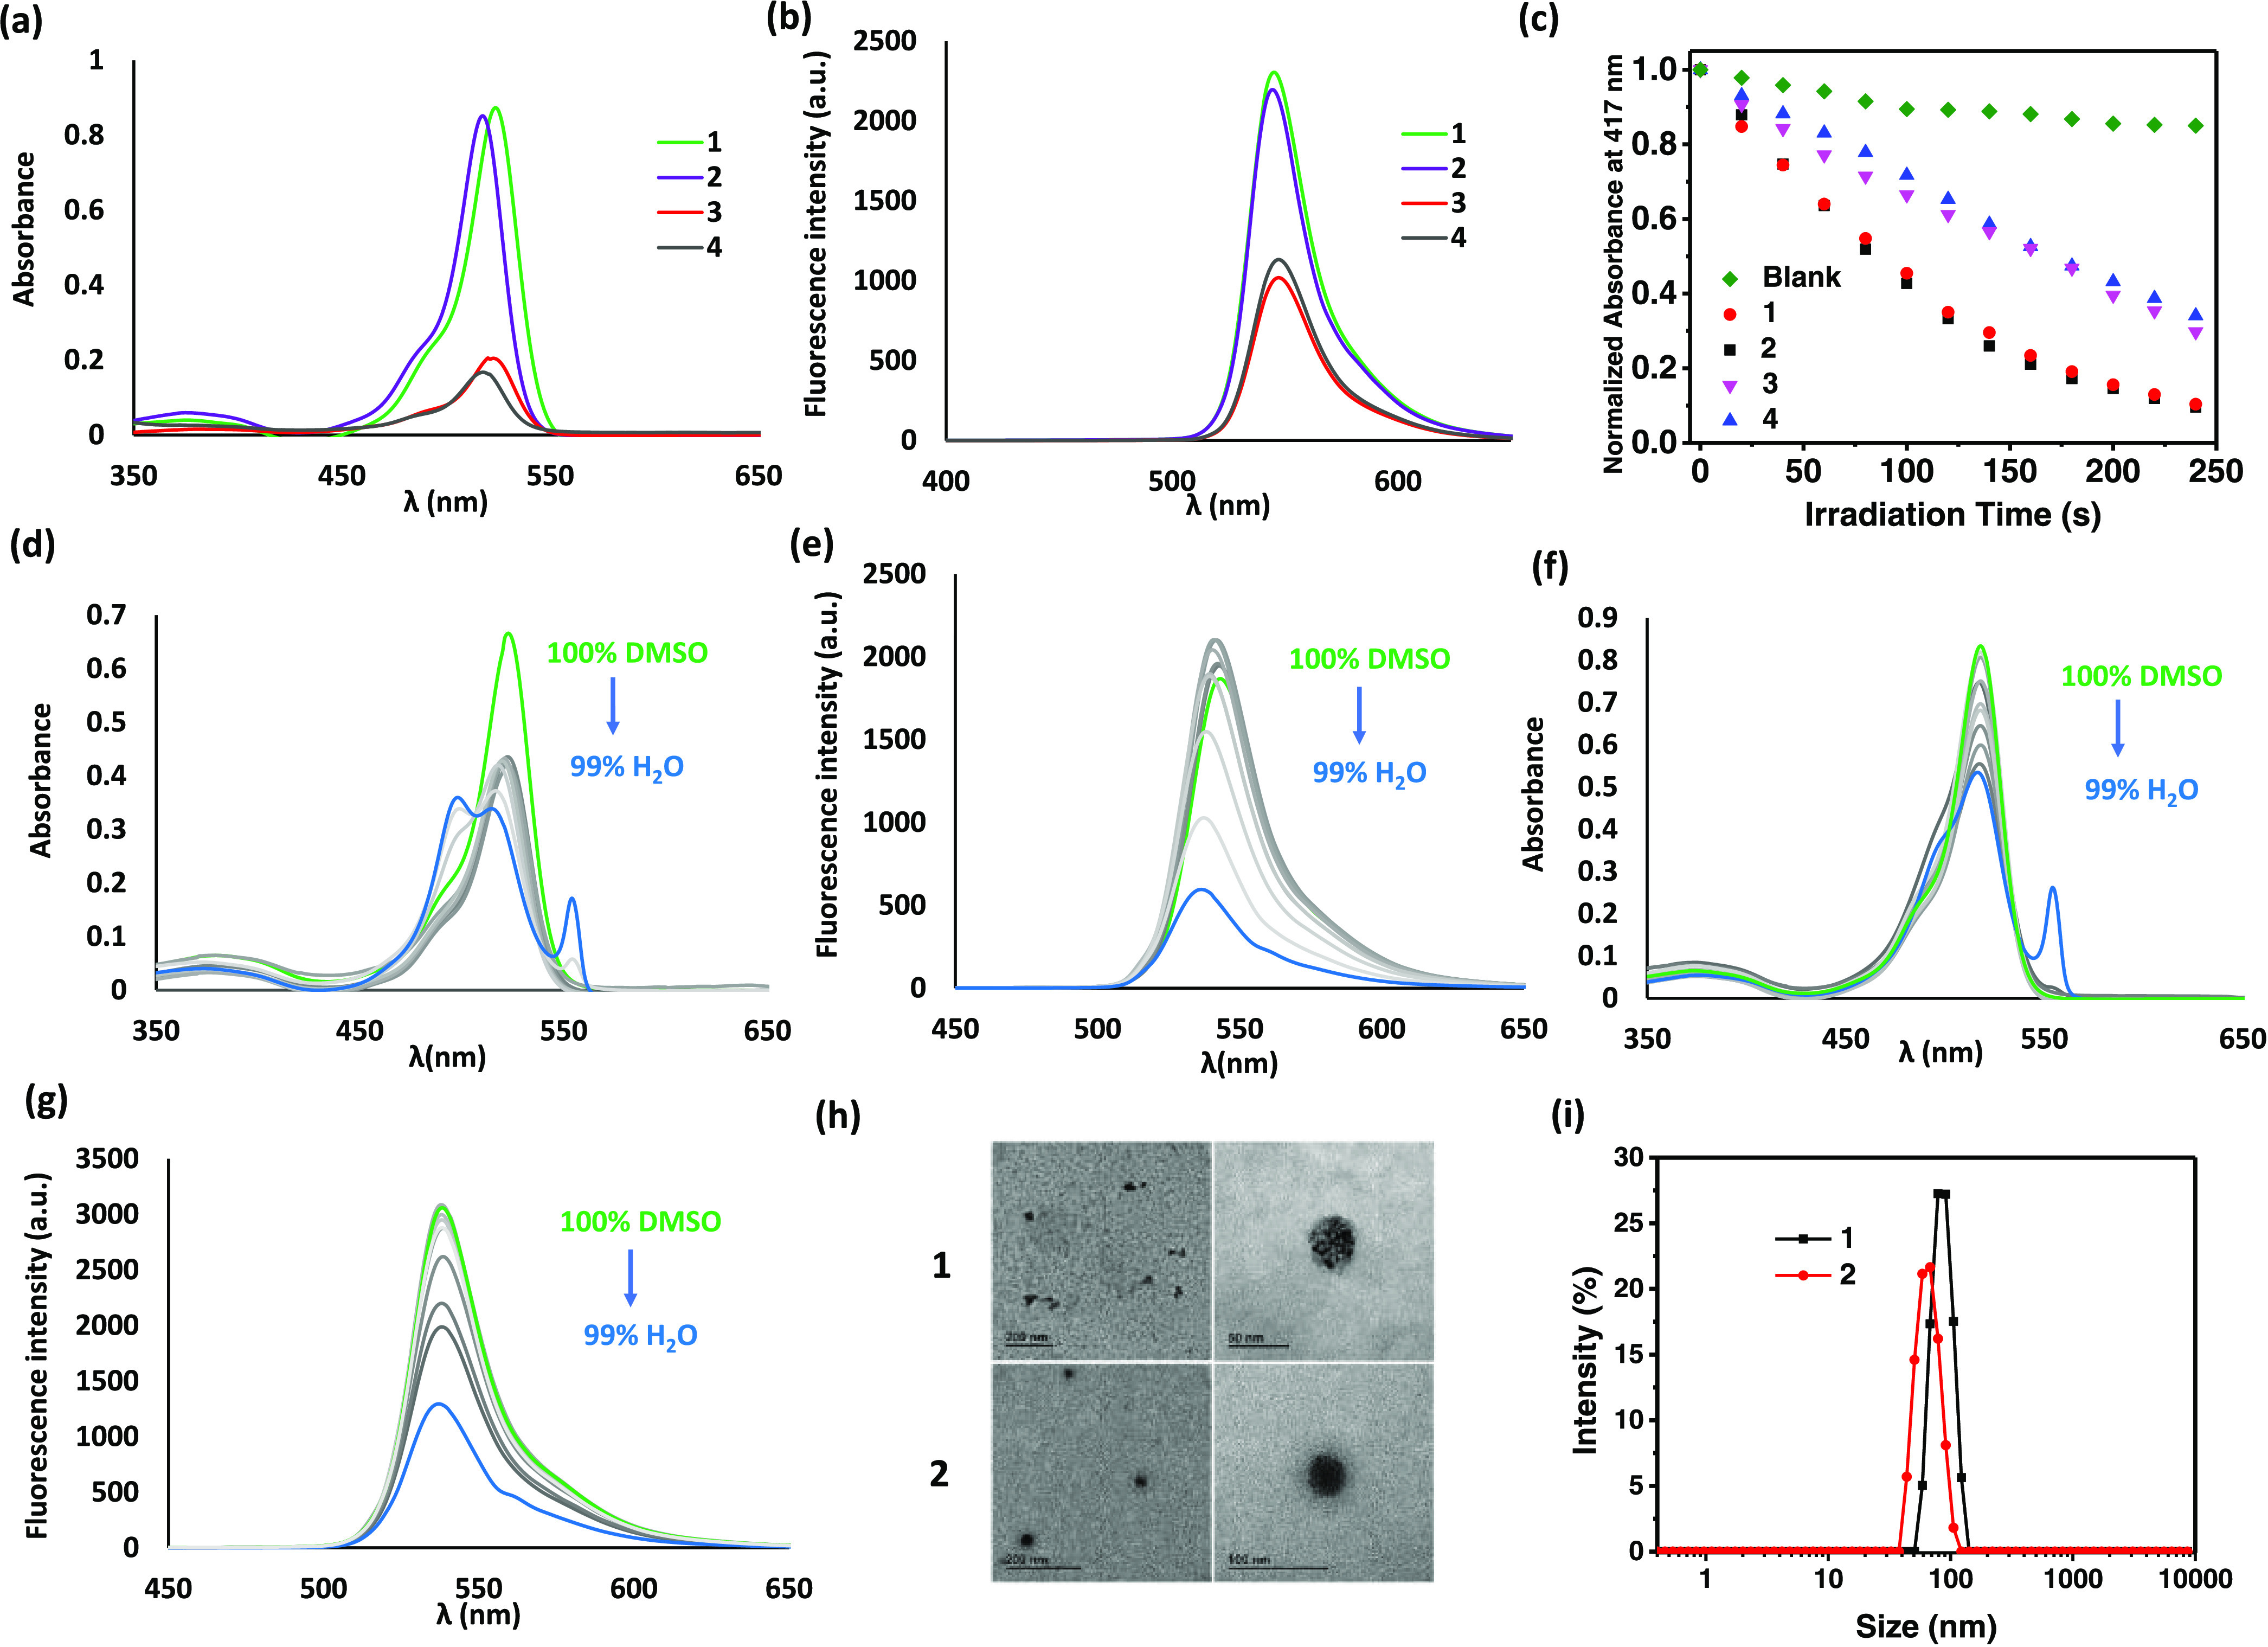
Figure 2.

(a) Absorption and (b) fluorescence spectra of 1–4 in DMSO (2 μM). (c) Rates of decay of DPBF (initial concentration = 30 μM), as monitored spectroscopically at 417 nm, in the absence and presence of 1 (4 μM), 2 (4 μM), 3 (12 μM), or 4 (12 μM) in DMSO upon irradiation (λ = 400–700 nm). Change in (d) absorption and (e) fluorescence spectra of 1 by changing the solvent from DMSO to 1% DMSO in water. Change in (f) absorption and (g) fluorescence spectra of 2 by changing the solvent from DMSO to 1% DMSO in water. (h) TEM images of Milli-Q water solutions of 1 and 2 deposited over formvar/carbon, copper grids after glow discharge treatment. (i) Hydrodynamic diameter distribution of 1 and 2 in water.
