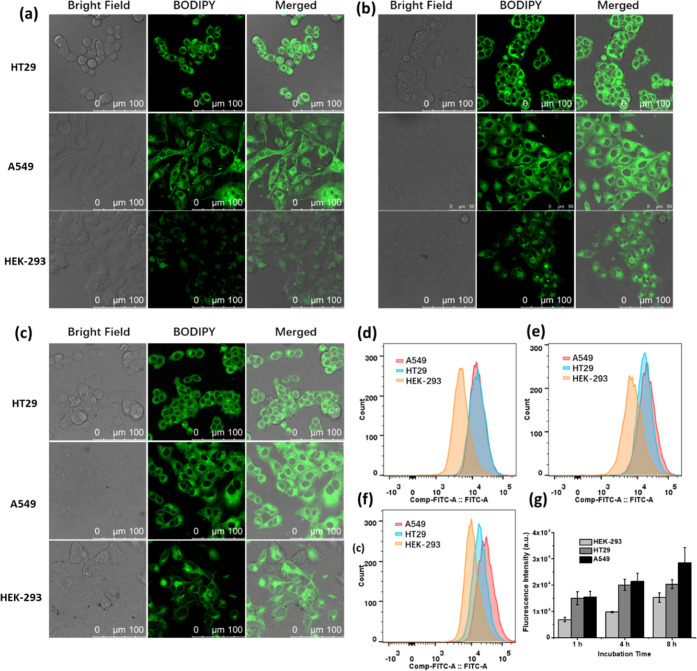
Figure 3.
Bright field, fluorescence, and merged confocal images of HT29, A549, and HEK-293 cells after incubation with 1 (4 μM) for (a) 1 h, (b) 4 h, and (c) 8 h, respectively. (d–f) Fluorescence intensity profiles of the cells being treated under these conditions, respectively, determined by flow cytometry. (g) Corresponding quantified intracellular fluorescence intensities. Data are expressed as the mean ± standard deviation (SD) of three independent experiments.

