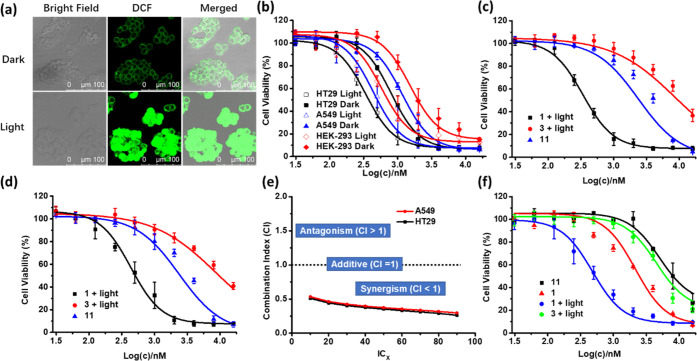
Figure 5.
(a) Intracellular ROS generation induced by 1 (4 μM) in HT29 cells, as reflected by the fluorescence of DCF in the absence and presence of light (λ = 400–700 nm, 23 mW cm–2, 28 J cm–2). (b) Comparison of the cytotoxic effect of 1 against HT29, A549, and HEK-293 cells in the absence and presence of light (λ = 400–700 nm, 23 mW cm–2, 28 J cm–2). Comparison of the cytotoxic effect of 1, 3, and 11 against (c) HT29 and (d) A549 cells. For the treatment with 1 and 3, light irradiation (λ = 400–700 nm, 23 mW cm–2, 28 J cm–2) was also applied. The concentrations for 3 and 11 were multiplied by 3 in the figures. (e) Variation of the combination index with the IC value determined from the dose-dependent survival curves of 1, 3, and 11 against HT29 and A549 cells. (f) Comparison of the cytotoxic effect of 1, 3, and 11 against the chemo-resistant R-HepG2 cells in the absence and presence of light (λ = 400–700 nm, 23 mW cm–2, 28 J cm–2). For (b)–(d) and (f), data are expressed as the mean ± standard error of the mean (SEM) of three independent experiments, each performed in quadruplicate.

