
Figure 5.
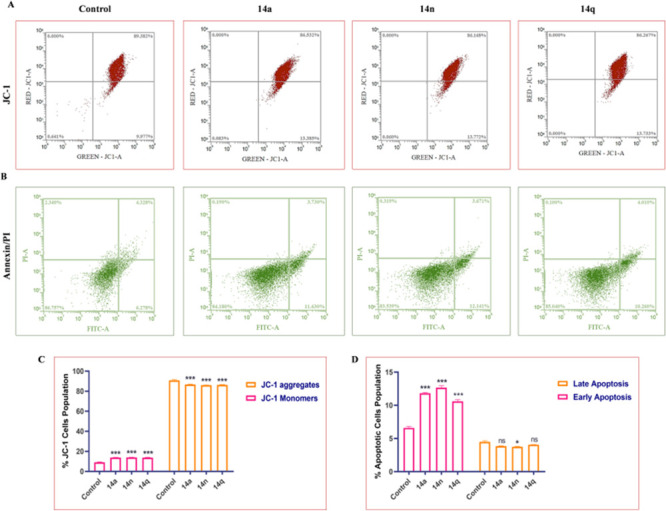
(A) Treatment of HT-29 cells with 14a (1 μM), 14n (2 μM), and 14q (4 μM) aggravates the formation of JC-1 aggregates and reduces the formation of monomers compared to the control. (B) Compounds induce apoptosis activation in HT-29 cells. Flow cytometry images depicting early apoptosis, late apoptosis, and necrotic population in HT-29 cells. (C) Flow cytometry bar graph depicting the % JC-1 cells’ population of HT-29 cells. (D) Bar graphs representing population of apoptotic cells as observed after Annexin/PI staining. Statistical significance was analyzed by two-way ANOVA followed by Tukey’s post hoc analysis, where *p < 0.05, **p < 0.01, and ***p < 0.001 represent control vs potent compounds 14a, 14n, and 14q in the treatment groups.