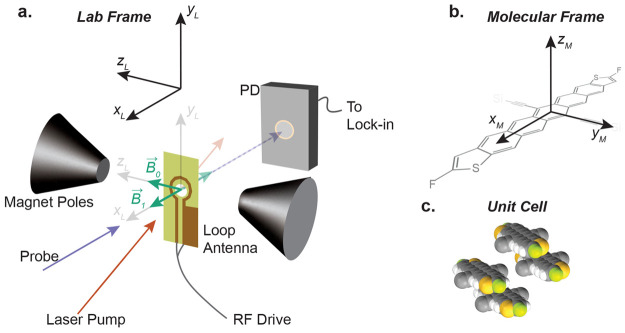
Figure 1.
The PADMR spectrometer. (a) Lab-frame view of the PADMR spectrometer. The sample is mounted to a PCB loop antenna, inside an optical cryostat, between the pole tips of an electromagnet. The probe beam passes through the center of the RF antenna, and its intensity is measured by a photodetector. A laser is overlapped with the probe. For PA experiments, only the laser is modulated. For PADMR experiments, only the RF is modulated. See SI section S1.2 for details. (b) The molecular reference frame commonly used for acenes is assumed valid here.33 (c) The unit-cell for crystallites of TSPS-PDT, first reported in ref (10), is reproduced here. The reduced symmetry of TSPS-PDT, relative to standard acenes, means that there are four unique nearest-neighbor-pair conformations, two of which are shown. To aid in visualization, the trialkylsilyl substituents are not included.

