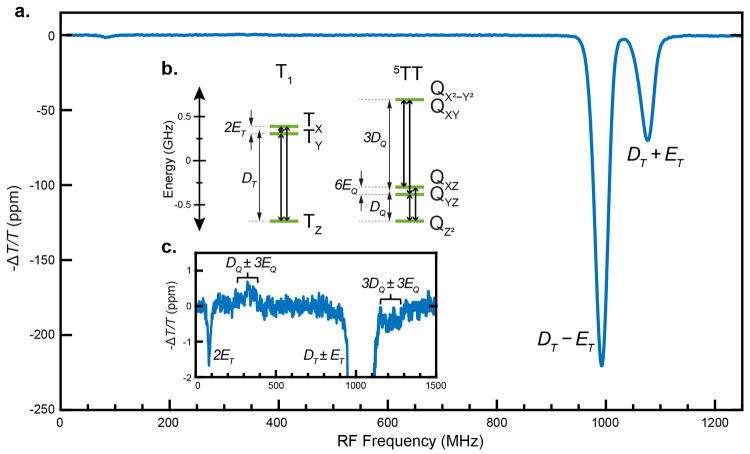
Figure 3.
The PADMR spectrum of TSPS-PDT is dominated by triplet signatures. (a) Detecting at the triplet PA’s peak, the f-PADMR spectrum of a TSPS-PDT film shows three main peaks (85, 990, and 1077 MHz), corresponding to transitions within the triplet manifold, T1 (600 nm probe, 642 nm continuous pump, pump intensity ≈ 15 W/cm2, 2.99 kHz RF-modulation frequency, zero magnetic field, temperature ≈ 5–10 K). The negative signals indicate that PA intensity is reduced by RF drive. These data have been rephased by ϕ = +29.8° to maximize the amplitude in a single channel (the rephasing process is discussed in SI sections S1.2.5 and S1.2.6). (b) Sublevel energy diagram for T1 (left) and 5TT (right) in the zero-field basis. Arrows show observed transitions. The T1 splittings are from a fit, with |DT| = 1033 MHz and |ET| = 41.6 MHz. The 5TT sublevels are named as in ref (4), and the splittings shown disregard anisotropic exchange.34 (c) Much weaker features are assigned to quintet transitions.

