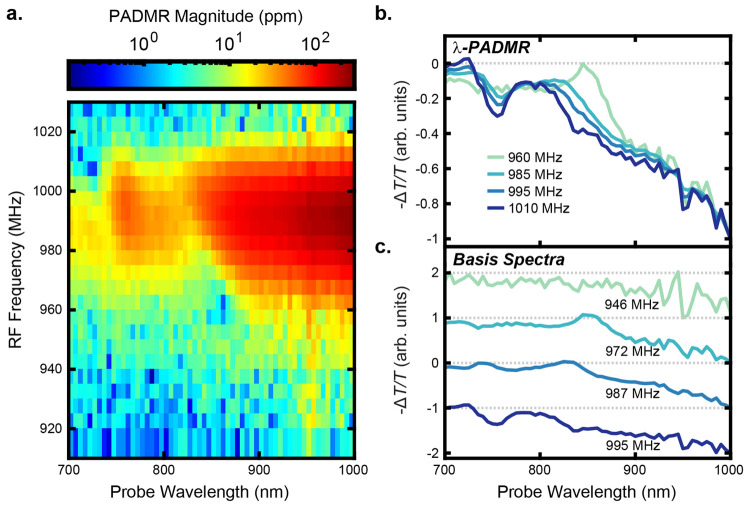
Figure 4.
f ×
λ-PADMR correlates near-IR PA with
T1 MR. (a) The PADMR signal magnitude,  , shows strong signals when probing the
1000 nm PA (Figure 2) and driving the TZ ↔ TY transition
(642 nm pump wavelength, pump intensity ≈ 15 W/cm2, fmodRF = 2.99 kHz, temperature
≈ 5–10 K). Slight asymmetry shows that the PA and MR
spectral positions are correlated. (b) λ-PADMR spectra demonstrate
shifting PA intensity as a function of fDrive. They are slices taken from a global fit of the
phase-optimized PADMR data (applied phase, ϕ = +34.2°;
see SI section S1.2.5 for a discussion
of the rephasing process). (c) The λ-PADMR basis spectra obtained
by the fit. All are most intense near 1000 nm. A superimposed positive
feature is seen at 850 nm when driven by 972 MHz RF and likely corresponds
to a GSB (RF increases ground-state population). It shifts to bluer
wavelengths with increasing fDriveRF. A similar shift is seen in a GSB near 740 nm, and pronounced
shifts are seen when probing near the 600 nm PA (SI section S2.3.1).

