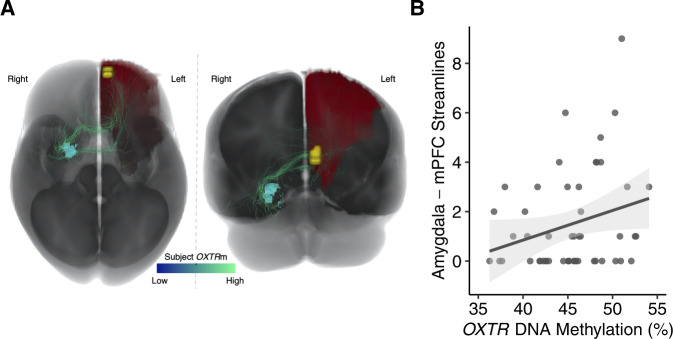
Fig. 2. Individuals with increased methylation of OXTR show greater right amygdala–mPFC structural connectivity.
A Visualization of total child cohort axonal connections between right amygdala (light blue) and the left frontal cortex ROI (red) while also displaying the location of the significant cluster determined from the fMRI analysis seeded in the right amygdala (yellow). Connections were visualized from the whole-brain tractograms of all subjects in the study and streamlines were colored based on the OXTRm of the associated subject, with darker blue signifying lower OXTRm and lighter green signifying higher OXTRm. B Number of streamlines are plotted against the percent OXTRm for each participant (n = 51). Gray shading indicates 95% confidence interval around the best-fit line.

