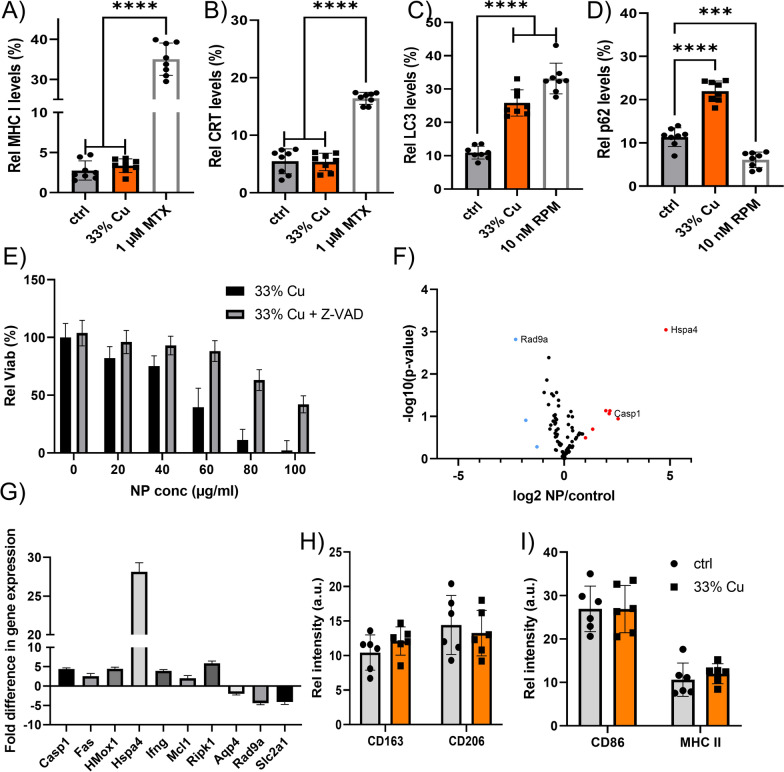
Fig. 5.
A, B Histograms displaying the relative level of A) surface-located MHC-I, B) surface-located calreticulin in KLN 205 cells exposed to saline control, 33% Cu-doped TiO2 NPs or 1 µM mitoxanthrone as positive control expressed as the relative level of cells positive for the marker out of the total population of cells analysed by ImageStreamX Mark II analysis. C, D Histograms displaying the relative level of C) autophagy marker LC3, D) autophagic flux marker p62 in KLN 205 cells exposed to saline control, 33% Cu-doped TiO2 NPs or 10 nM rapamycin as positive control expressed as the relative level of cells positive for the marker out of the total population of cells analysed by ImageStreamX Mark II analysis. E Histogram showing the viability of KLN 205 cells treated with 33% Cu-doped TiO2 NPs at the concentrations indicated in the presence and absence of caspase-inhibitor Z-VAD-fmk. Data are expressed as mean ± SEM (n = 4). F Volcano plot for 84 genes related to cellular stress and toxicity analyzed in untreated KLN 205 cells and 33% Cu-doped TiO2 NPs at 20 µg/ml for 24 h, where significant differences in expressed genes are indicated in orange (overexpression) or blue (underexpression). G The significant genes found in F) are further indicated with their respective fold difference compared to untreated KLN 205 cells. Data are expressed as mean ± SEM (n = 4). H, I Histograms of RAW 264.7 macrophages either untreated or exposed to 33% Cu-doped TiO2 NPs at 40 µg/ml for 24 h, displaying the level of surface-located H) M2 macrophage markers (CD163, CD206) or I) M1 macrophage markers (CD86, MHC-II). Significant differences between a treated group and untreated controls at the same time point are indicated where relevant (p < 0.001: ***; p < 0.0001: ****) based on ANOVA testing using GraphPad Prism 9 (n = 8)

