Fig. 7.
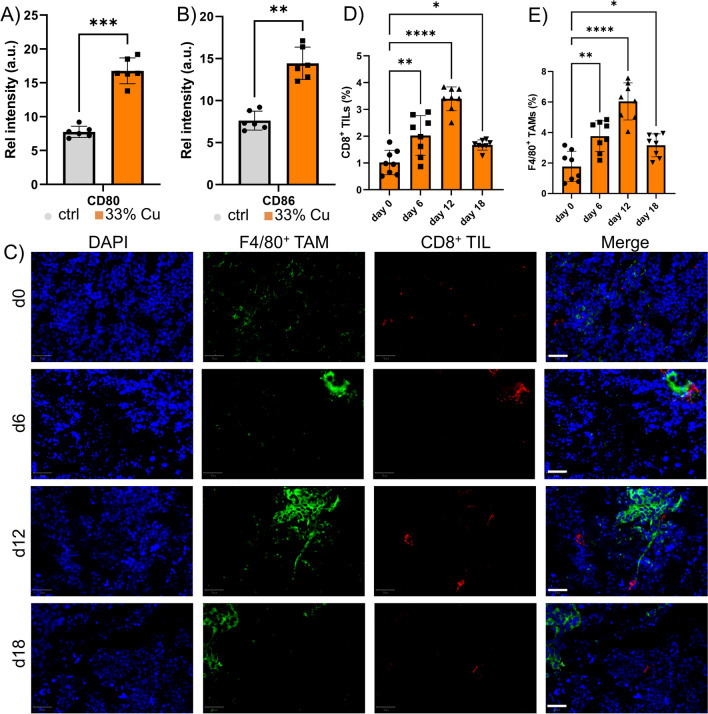
A, B Histograms displaying the relative level of A) CD80 and B) CD86 in in vitro cultured conditionally immortalized DCs exposed to supernatant of E0771 cells that were previously incubated with either saline (control) or 33% Cu-doped TiO2 NPs. C Representative micrographs of tumor sections obtained from animals bearing KLN 205 subcutaneous tumors treated with 33% Cu-doped TiO2 NPs. Images are shown of tumors isolated 0, 6, 12 or 18 days following NP administration. The tissue sections were counterstained with DAPI nuclear stain (blue), following staining against F4/80 (green, TAMs) and CD8 (red, cytotoxic T cells). The images on the right show the merged images. Scale bars: 250 µm. D, E Histograms indicating the level of D) CD8+ TIL and E) F4/80+ TAMs expressed relative to the total number of cells in the tumor section as analyzed using QuPath analyzer for tissues obtained 0, 6, 12 or 18 days following NP administration

