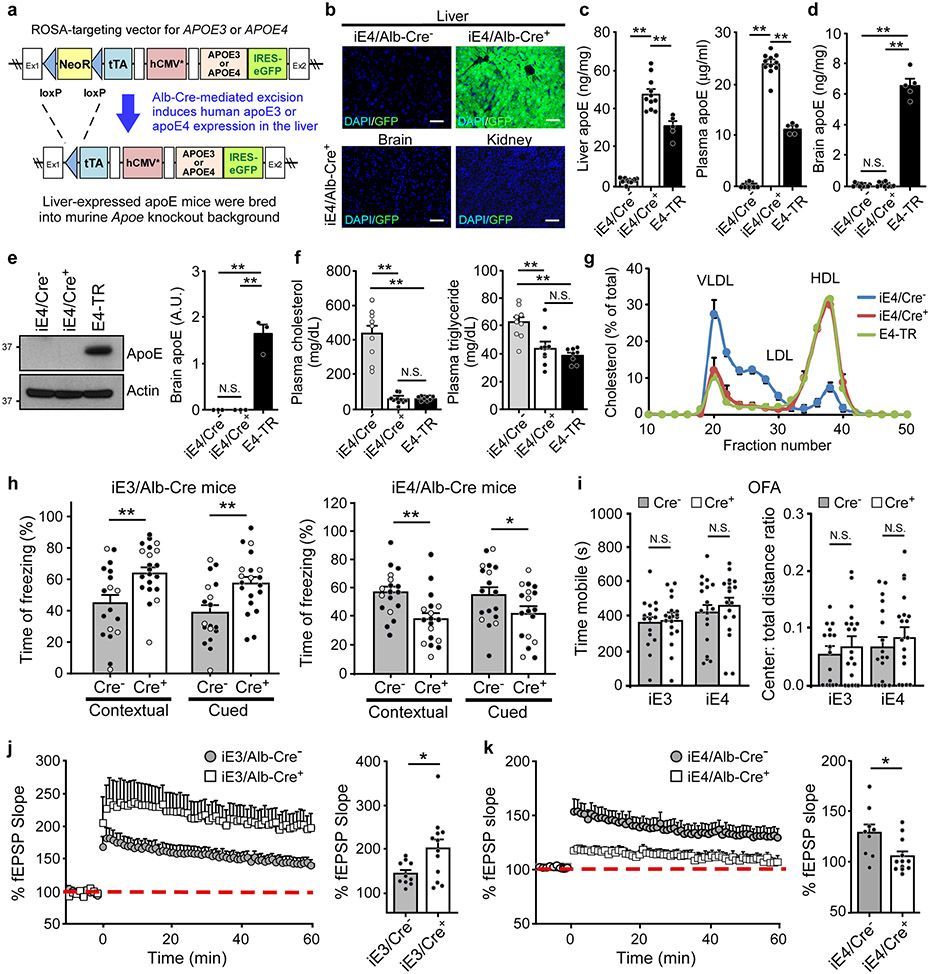
Fig. 1 ∣. Opposing effects of liver-expressed apoE3 and apoE4 on brain cognition and synaptic function.
a, The structure of the ROSA-targeting vector with the Tet-off regulatory cassette for APOE and eGFP expression. Breeding to Alb-Cre mice removed the loxP-flanked Neor gene and led to expression of human apoE3 or apoE4 in the liver. b, GFP was exclusively detected in the liver of iE4/Cre+ mice. Similar results were observed in at least three independent experiments. Scale bar, 50 μm. c, d, ApoE levels in the liver, plasma, or brain of iE4/Cre mice (Cre−, n=11; Cre+, n=11) and apoE4-TR mice (n=5) at 12-13 months of age were examined by ELISA. **, P<0.0001. e, No apoE was detected in the brains of iE4/Cre mice (n=3/group) at 12-13 months of age by Western blotting. **, P=0.0002. f, Total cholesterol and triglyceride levels in the plasma of iE4/Cre mice (Cre−, n=9; Cre+, n=10) and apoE4-TR mice (n=8) were examined. Cholesterol: **, P<0.0001; Triglyceride: **, P=0.003 (Cre− vs. Cre+); P=0.0004. g, Distribution of plasma lipoprotein cholesterol in iE4/Cre− or iE4/Cre+ mice (n=3/group). Pooled plasma from apoE4-TR mice (n=3) was included as controls. N.S., not significant. One-way analysis of variance (ANOVA) with Tukey’s post-hoc test. h, Memory performance of mice expressing apoE3 (Cre−, n=18; Cre+, n=21 for contextual test; **, P=0.003; Cre−, n=18; Cre+, n=20 for cued test; **, P=0.005) or apoE4 (Cre−, n=18; Cre+, n=18; **, P=0.003; *, P=0.048) in the liver examined by fear conditioning tests. The percentage of time spent showing freezing behavior in response to stimulus is shown. Black circle: male; Grey circle: female. i, Analyses of anxiety-related behaviors in iE3/Cre (Cre−, n=16; Cre+, n=19) and iE4/Cre mice (Cre−, n=18; Cre+, n=18) assessed by open field analysis (OFA). N.S., not significant. j, k, Normalized fEPSP responses to field stimulation were summarized during recordings from the CA1 region of hippocampal slices from iE3/Cre mice (Cre−, n=10; Cre+, n=12) or iE4/Cre mice (Cre−, n=9; Cre+, n=12). Averages of the last 5 min of fEPSP recording were quantified. Data represent mean ± s.e.m.; iE3: *, P=0.03; iE4: *, P=0.018, two-tailed Student's t-test.

