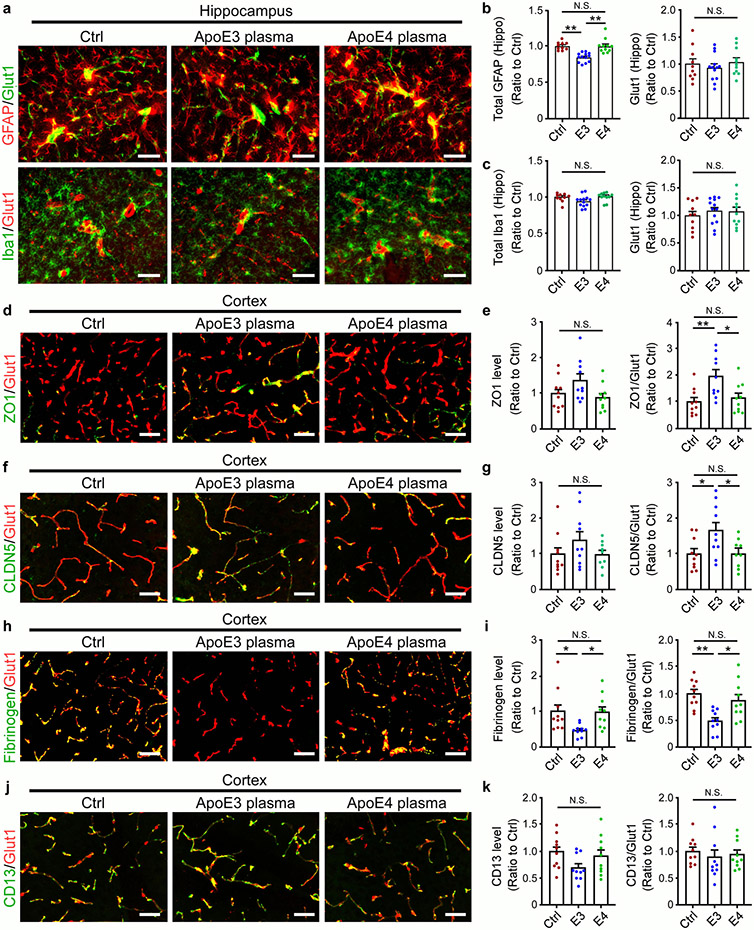
Extended Data Fig. 7. Reduced vessel-associated astrocytes and microglia in aged mice treated with apoE3 young plasma.
Brain tissues from aged mice treated with Ctrl (PBS/sodium citrate), apoE3, or apoE4 young plasma were subjected to co-immunostaining for GFAP (astrocyte) or Iba1 (for microglia) together with Glut1 (endothelial marker). a, Representative images for the hippocampus of treated experimental mice are shown. Scale bar, 50 μm. b, Quantification of total GFAP and Glut1 (Ctrl: 10 mice; E3: 13 mice; E4: 11 mice) in the hippocampus. **, P<0.0001. c, Quantification of total Iba1 and Glut1 (Ctrl: 10 mice; E3: 13 mice; E4: 11 mice) in the hippocampus. d, e, Cortical brain tissues from young plasma-treated mice were co-stained for tight junction (TJ) protein ZO1 (green) and an endothelial marker Glut1 (red). Scale bar, 50 μm. e, The total ZO1 and TJ coverage (ZO1 against Glut1) was quantified (Ctrl: 10 mice; E3: 10 mice; E4: 10 mice). *, P=0.02; **, P=0.007. f, g, Cortical brain tissues from young plasma-treated mice were co-stained for TJ protein CLDN5 (green) and an endothelial marker Glut1 (red). Scale bar, 50 μm. g, The total CLDN5 and TJ coverage (CLDN5 against Glut1) was quantified (Ctrl: 10 mice; E3: 10 mice; E4: 9 mice). Ctrl vs. E3 (*, P=0.034); E3 vs. E4 (*, P=0.044). h, i, Cortical brain tissues from young plasma-treated mice were co-stained for blood protein fibrinogen (green) and an endothelial marker Glut1 (red). Scale bar, 50 μm. i, The total fibrinogen and the fibrinogen/Glut1 signal was quantified (Ctrl: 10 mice; E3: 10 mice; E4: 10 mice). Fibrinogen: Ctrl vs. E3 (*, P=0.04); E3 vs. E4 (*, P=0.045). Fibrinogen/Glut1: Ctrl vs. E3 (**, P=0.001); E3 vs. E4 (*, P=0.015). j, k, Cortical brain tissues from young plasma-treated mice were co-stained for a pericyte marker CD13 (green) and an endothelial marker Glut1 (red). Scale bar, 50 μm. k, The total CD13 signal and pericyte coverage (CD13 against Glut1) was quantified (Ctrl: 10 mice; E3: 10 mice; E4: 10 mice). b-k, Data represent mean ± s.e.m. N.S., not significant, one-way ANOVA with a Tukey’s post-hoc test.

