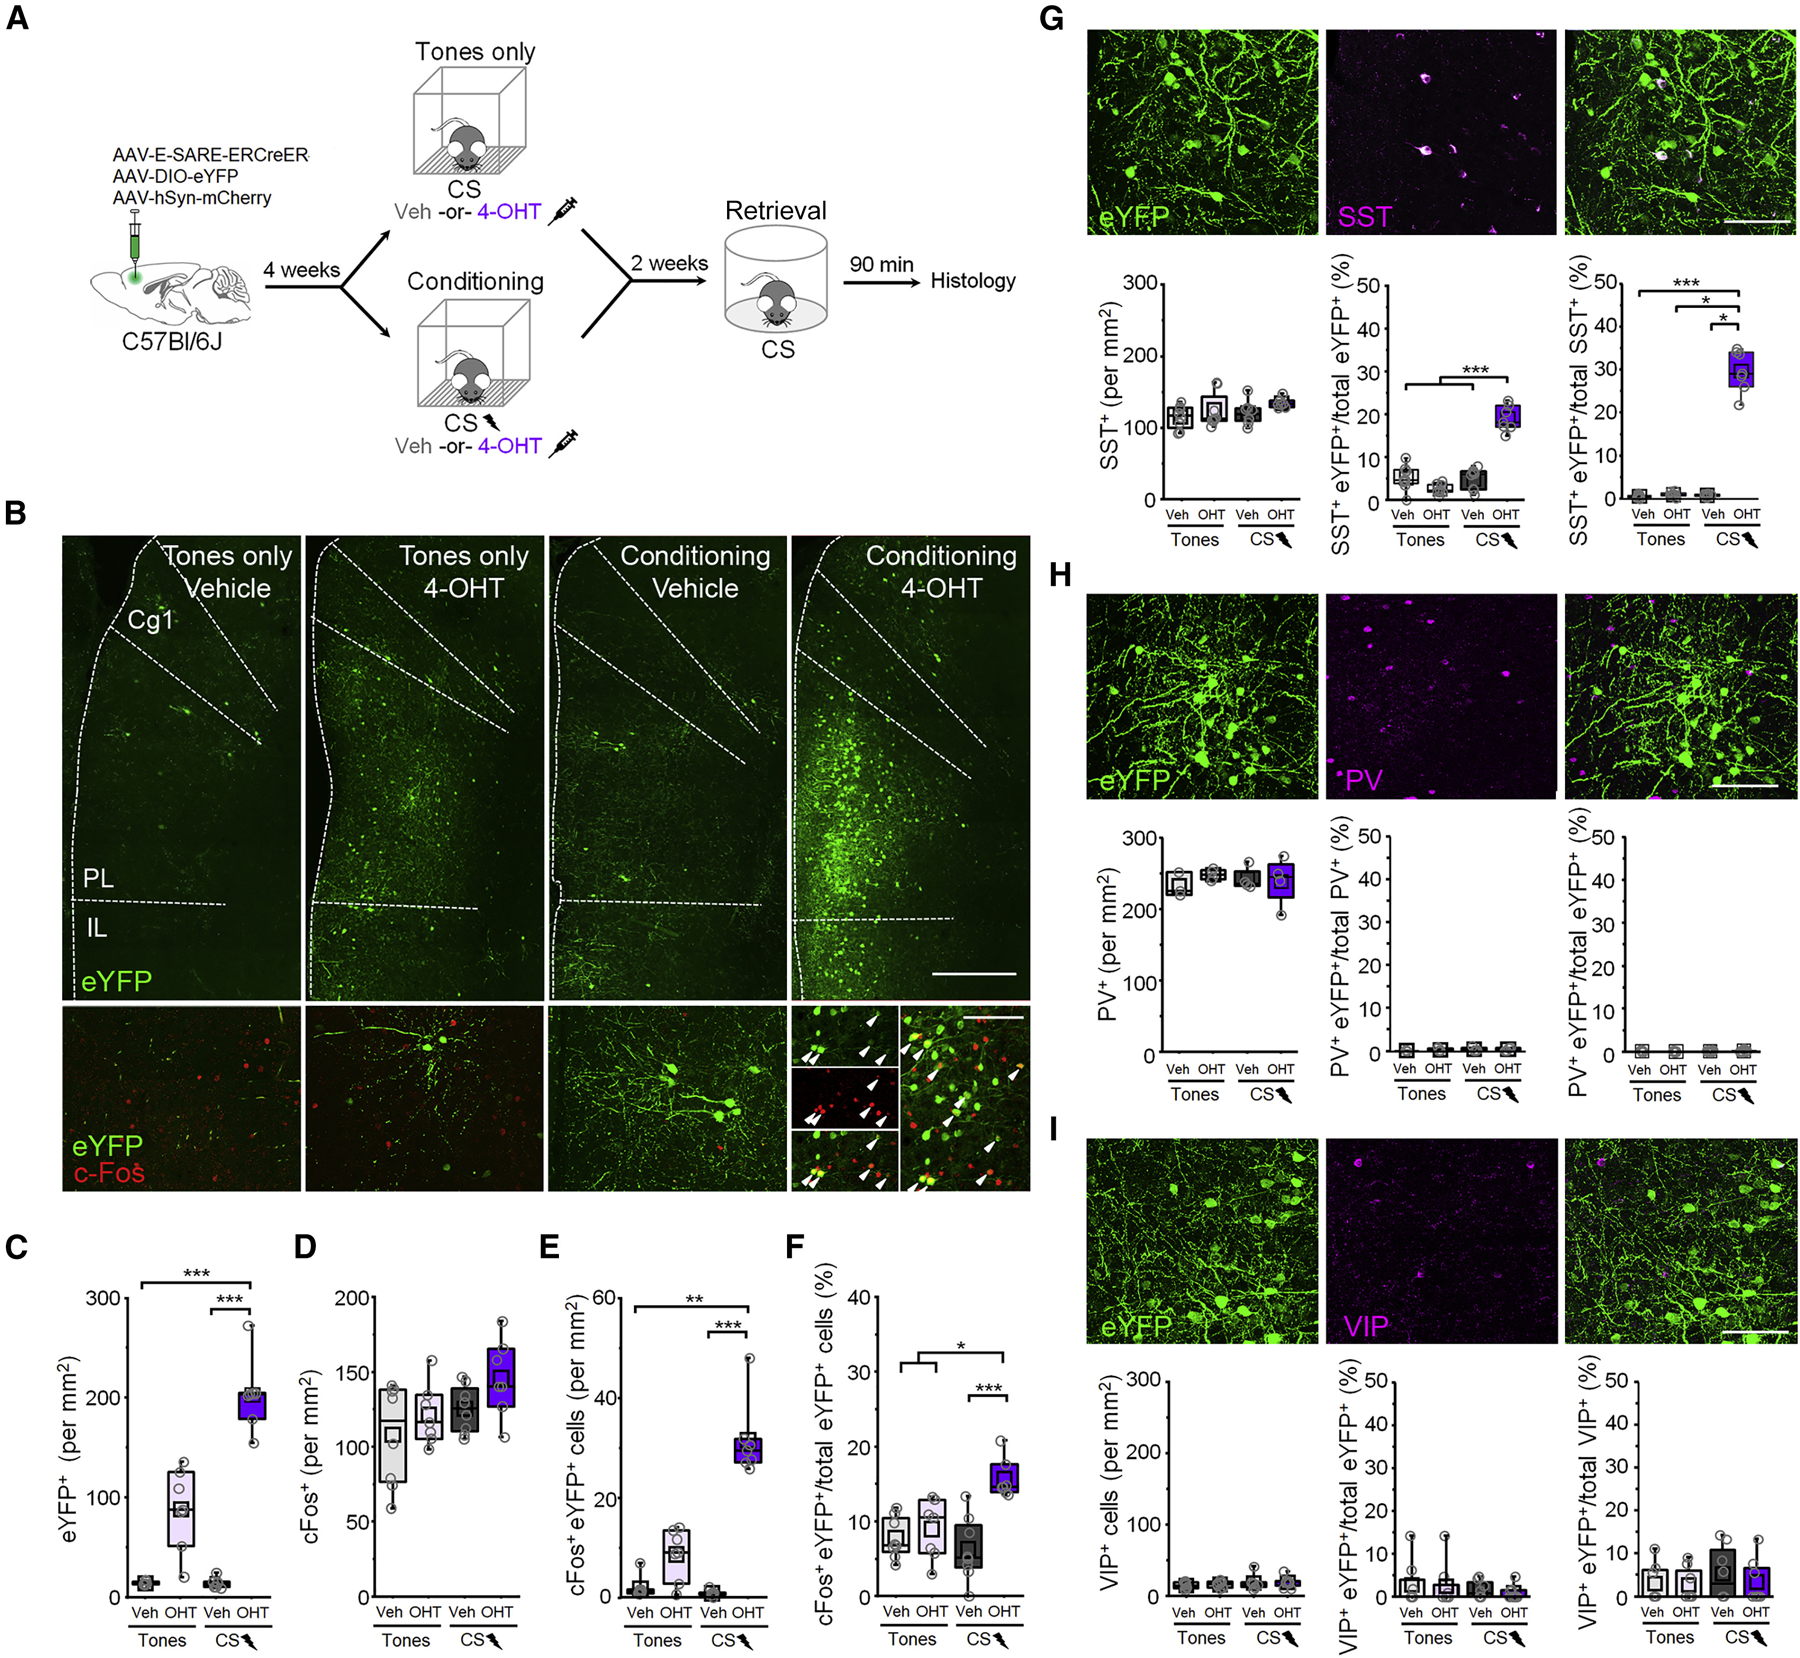
Figure 1. Fear conditioning recruits a cell population that is reactivated upon retrieval and is partially comprised of somatostatin-expressing interneurons.

(A) Timeline for cellular tagging during fear conditioning followed by cFos analysis of retrieval-dependent reactivation. (B) Top: representative eYFP tagging. Scale bar = 500 µm. Bottom: cFos induction following the retrieval test. White arrowheads denote cFos+ eYFP neurons. Scale bar = 100 µm. Cg1 = cingulate area 1. PL = prelimbic cortex. IL = infralimbic cortex. (C-F) Boxplot comparison between tones only vehicle (n = 8 mice), tones only 4-OHT (n = 7 mice), conditioned vehicle (n = 8 mice), and conditioned 4-OHT (n = 7 mice) groups of (C) number of eYFP+ cells: χ2 = 23.7 (3), p = 2.89 × 10⁻⁵, Kruskal-Wallis ANOVA; (D) number of cFos+ cells: χ2 = 5.75 (3), p = 0.12, Kruskal-Wallis ANOVA; (E) number of cFos+/eYFP+ double positive cells: χ2 = 20.9 (3), p = 1.09 × 10⁻⁴, Kruskal-Wallis ANOVA; and (F) number of cFos+/eYFP+ double positive cells normalized to the total number of eYFP+ cells: χ2 = 16.7 (3), p = 8.05 × 10⁻⁴, Kruskal-Wallis ANOVA. (G) SST labeling following CS-US pairing and 4-OHT injection. Scale = 50 µm. Bottom, boxplot comparison of labeling in tones only vehicle (n = 8 mice), tones only 4-OHT (n = 8 mice), conditioning vehicle (n = 8 mice), and conditioning 4-OHT (n = 7 mice). SST+ cells: χ2 = 6.93 (3), p = 0.074, Kruskal-Wallis ANOVA. SST+ eYFP cells normalized to the total number of eYFP cells: F(1,27) = 87.9, p = 5.55 × 10⁻¹⁰, interaction between training and treatment, 2-way ANOVA. SST+ eYFP cells normalized to the total number of SST+ cells per group: χ2 = 17.04 (3), p = 6.93 × 10⁻⁴, Kruskal-Wallis ANOVA. (H) PV labeling following CS-US pairing and 4-OHT injection. Scale = 50 µm. Bottom, boxplot comparison of labeling in tones only vehicle (n = 3), tones only 4-OHT (n = 4), conditioning vehicle (n = 4), and conditioning 4-OHT (n = 4). PV+ cells: F(1,40) = 0.73, p = 0.41, 2-way ANOVA. PV+ eYFP cells normalized to the total number of eYFP+ cells per group: χ2 = 0.88 (3), p = 0.83, Kruskal-Wallis ANOVA. PV+ eYFP cells normalized to the total number of PV+ cells per group: χ2 = 1.31 (3), p = 0.73, Kruskal-Wallis ANOVA. (I) VIP labeling following CS-US pairing and 4-OHT injection. Scale = 50 µm. Bottom, boxplot comparison between tones only vehicle (n = 8), tones only 4-OHT (n = 8), conditioning vehicle (n = 8), and conditioning 4-OHT (n = 8). VIP+ cells: χ2 = 1.84 (3), p = 0.606, Kruskal-Wallis ANOVA. VIP+ eYFP cells normalized to the total number of eYFP+ cells per group: χ2 = 0.359 (3), p = 0.949, Kruskal-Wallis ANOVA. VIP+ eYFP cells normalized to the total number of VIP+ cells per group: χ2 = 1.02 (3), p = 0.796, Kruskal-Wallis ANOVA. * p < 0.05, ** p < 0.01, *** p < 0.001 by Tukey’s post-hoc test (G) or Dunn’s post-hoc test (C, E, F, G). See also Figures S1-S3.
