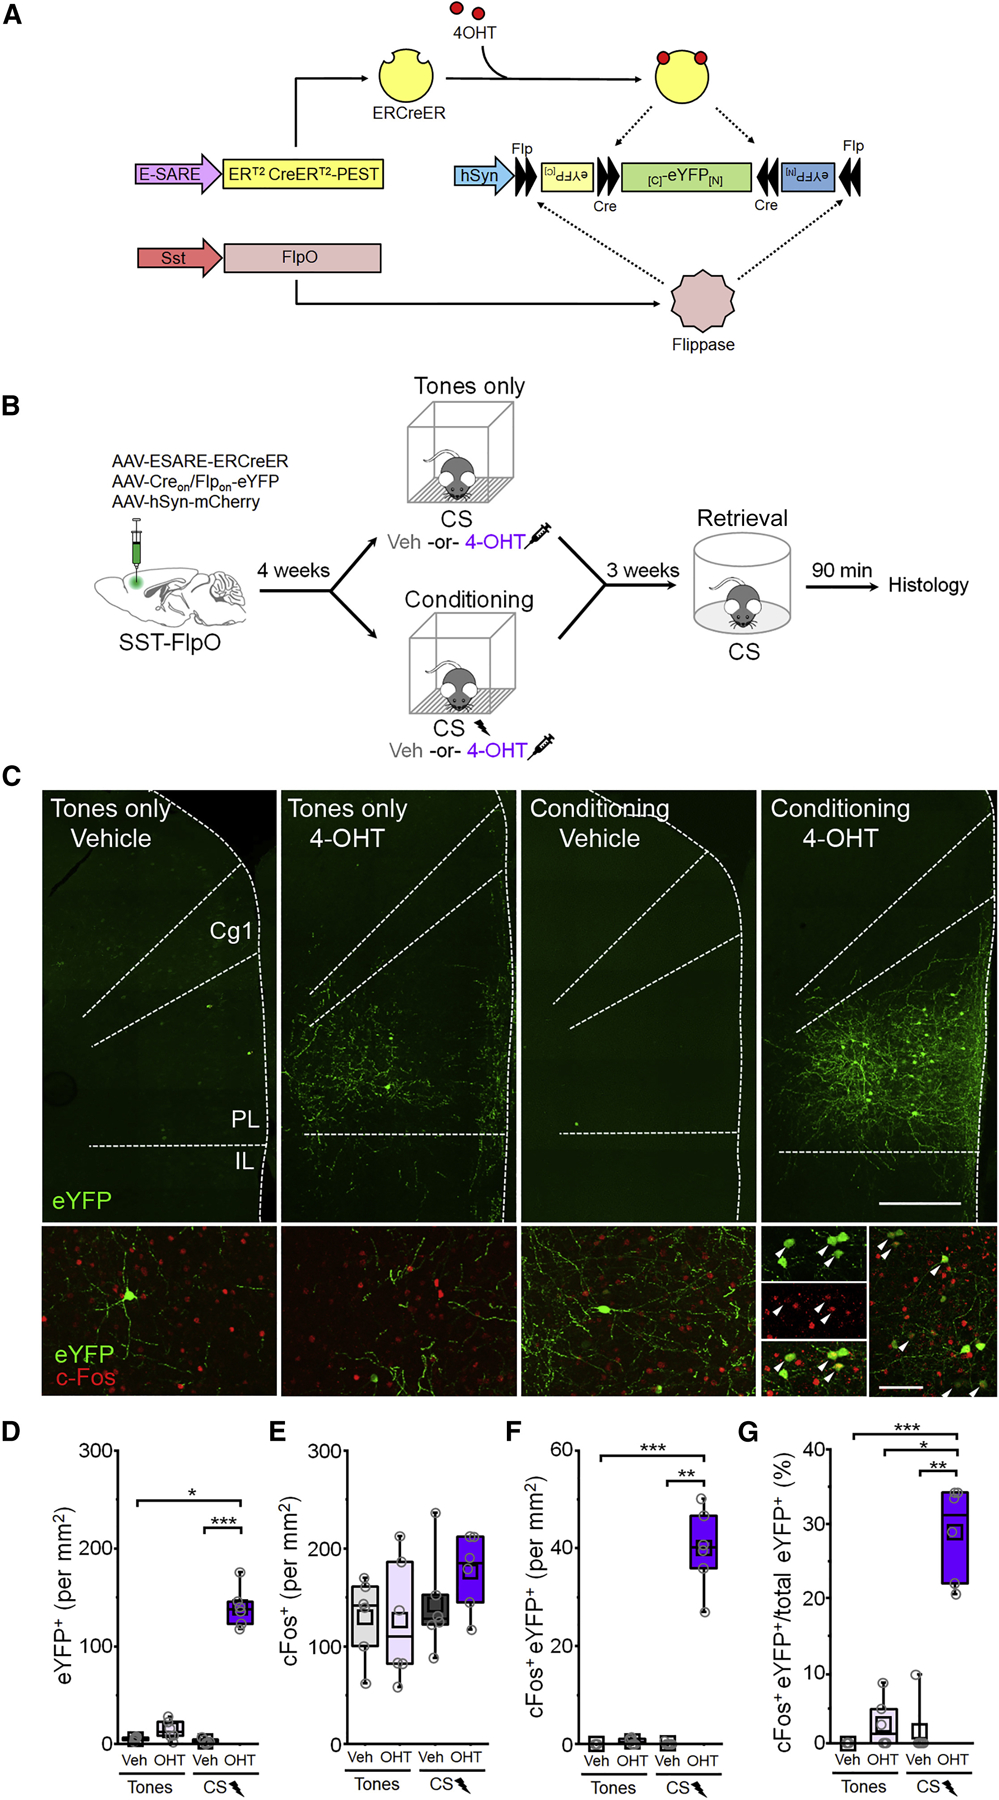
Figure 2: Fear learning-activated somatostatin-interneurons are preferentially reactivated upon memory retrieval.

(A) Intersectional genetic targeting. (B) Timeline for cellular tagging followed by cFos analysis of retrieval-dependent reactivation. (C) Top: representative eYFP tagging. Scale bar = 500 µm. Bottom: cFos induction following retrieval. White arrowheads denote cFos+ eYFP neurons. Scale bar = 100 µm. Cg1 = cingulate area 1. PL = prelimbic cortex. IL = infralimbic cortex. (D-G) Boxplot comparison between tones only vehicle (n = 6 mice), tones only 4-OHT (n = 6 mice), conditioning vehicle (n = 6 mice), and conditioning 4-OHT (n = 6 mice) groups of (D) number of eYFP+ cells: χ2 = 17.6 (3), p = 5.20 × 10⁻⁴, Kruskal-Wallis ANOVA; (E) number of cFos+ cells: number of cFos+ cells: F(1,20) = 0.82, p = 0.38, 2-way ANOVA. (F) number of cFos+/eYFP+ double positive cells: χ2 = 18.0 (3), p = 4.46 × 10⁻⁴, Kruskal-Wallis ANOVA; and (G) number of cFos+/eYFP+ double positive cells normalized to the total number of eYFP+ cells in each group: χ2 = 17.5 (3), p = 5.49 × 10⁻⁴, Kruskal-Wallis ANOVA. p < 0.05, ** p < 0.01, *** p < 0.001, Dunn’s post-hoc test (D,F,G). See also Figure S4.
