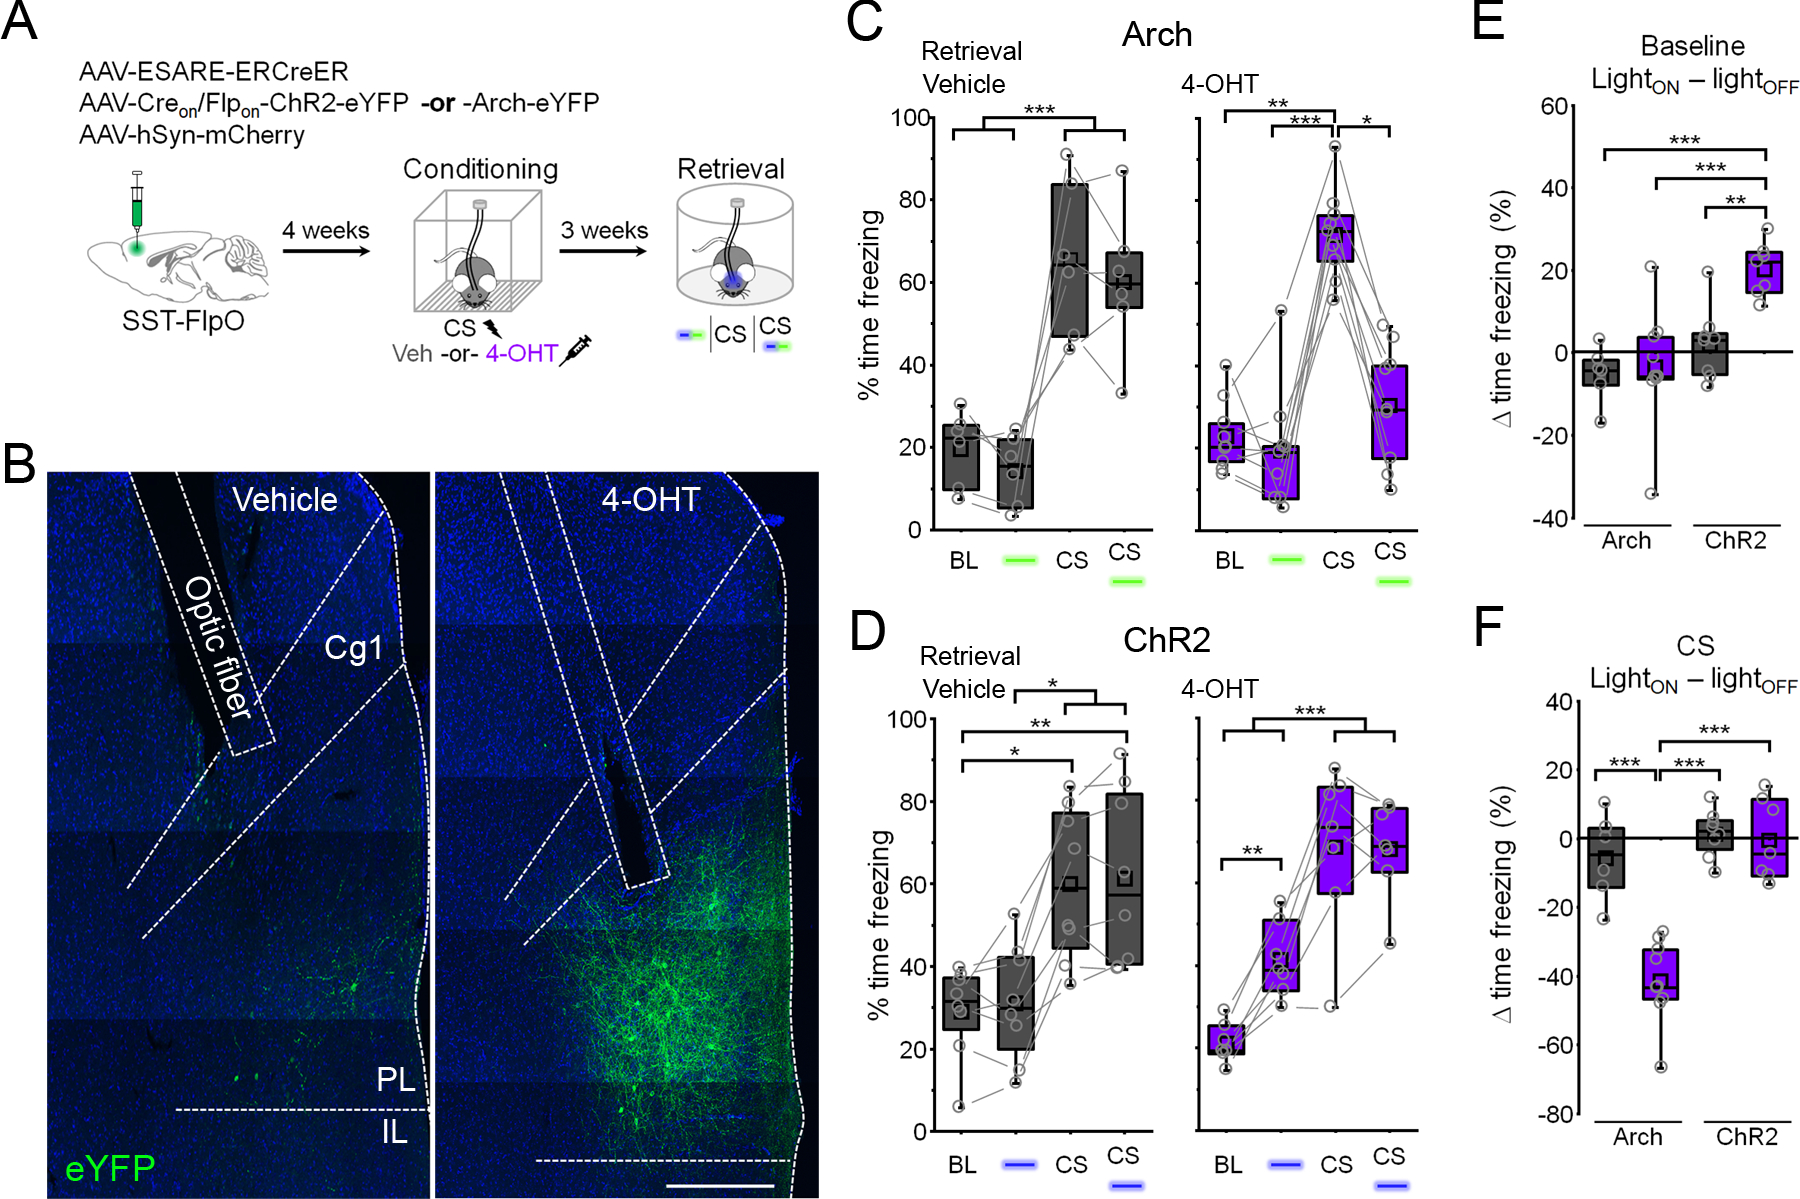
Figure 3: Fear learning-activated somatostatin interneurons control cue-elicited freezing.

(A) Timeline for cellular tagging and optogenetic analysis of fear behavior. (B) Representative ChR2 expression and optic fiber placement. Scale = 500 µm. Cg1 = cingulate area 1. PL = prelimbic cortex. IL = infralimbic cortex. (C) Boxplots depict modulation of freezing by light (532 nm, constant, 20 s epochs) and CS trials in vehicle (gray) and 4-OHT (purple) injected mice expressing Arch. Vehicle: F(3,15) = 22.1, p = 9.18 × 10⁻⁶, 1-way repeated measures ANOVA, n = 6 mice. 4-OHT: χ2 = 17.4 (3), p = 5.85 × 10⁻⁴, Friedman ANOVA, n = 9 mice. (D) Boxplots depict modulation of freezing by light (473 nm, 10 ms pulses, 20 Hz, 20 s epochs) and CS trials in vehicle (gray) and 4-OHT (purple) injected mice expressing ChR2. Vehicle: χ2 = 19.5 (3), p = 2.15 × 10⁻⁴, Friedman ANOVA, n = 8 mice. 4-OHT: F(3,18) = 46.7, p = 1.07 × 10⁻⁸, 1-way repeated measures ANOVA, n = 7 mice. (E) Boxplots depict change in freezing induced by photostimulation during the baseline period in (C) and (D). Effect of photostimulation (LightON – lightOFF): F (1,26) = 4.73, p = 0.039, 2-way ANOVA. (F) Boxplots depict change in freezing induced by photostimulation during the CS in (C) and (D). Effect of photostimulation (LightON – lightOFF): F (1,26) = 17.5, p = 2.87 × 10⁻⁴, 2-way ANOVA. ** p < 0.01, *** p < 0.001, Tukey’s post-hoc test (C: vehicle, D: 4-OHT, E, F). * p < 0.05, ** p < 0.01, *** p < 0.001, Dunn’s post-hoc test (C: 4-OHT, D: vehicle). See also Figure S5.
