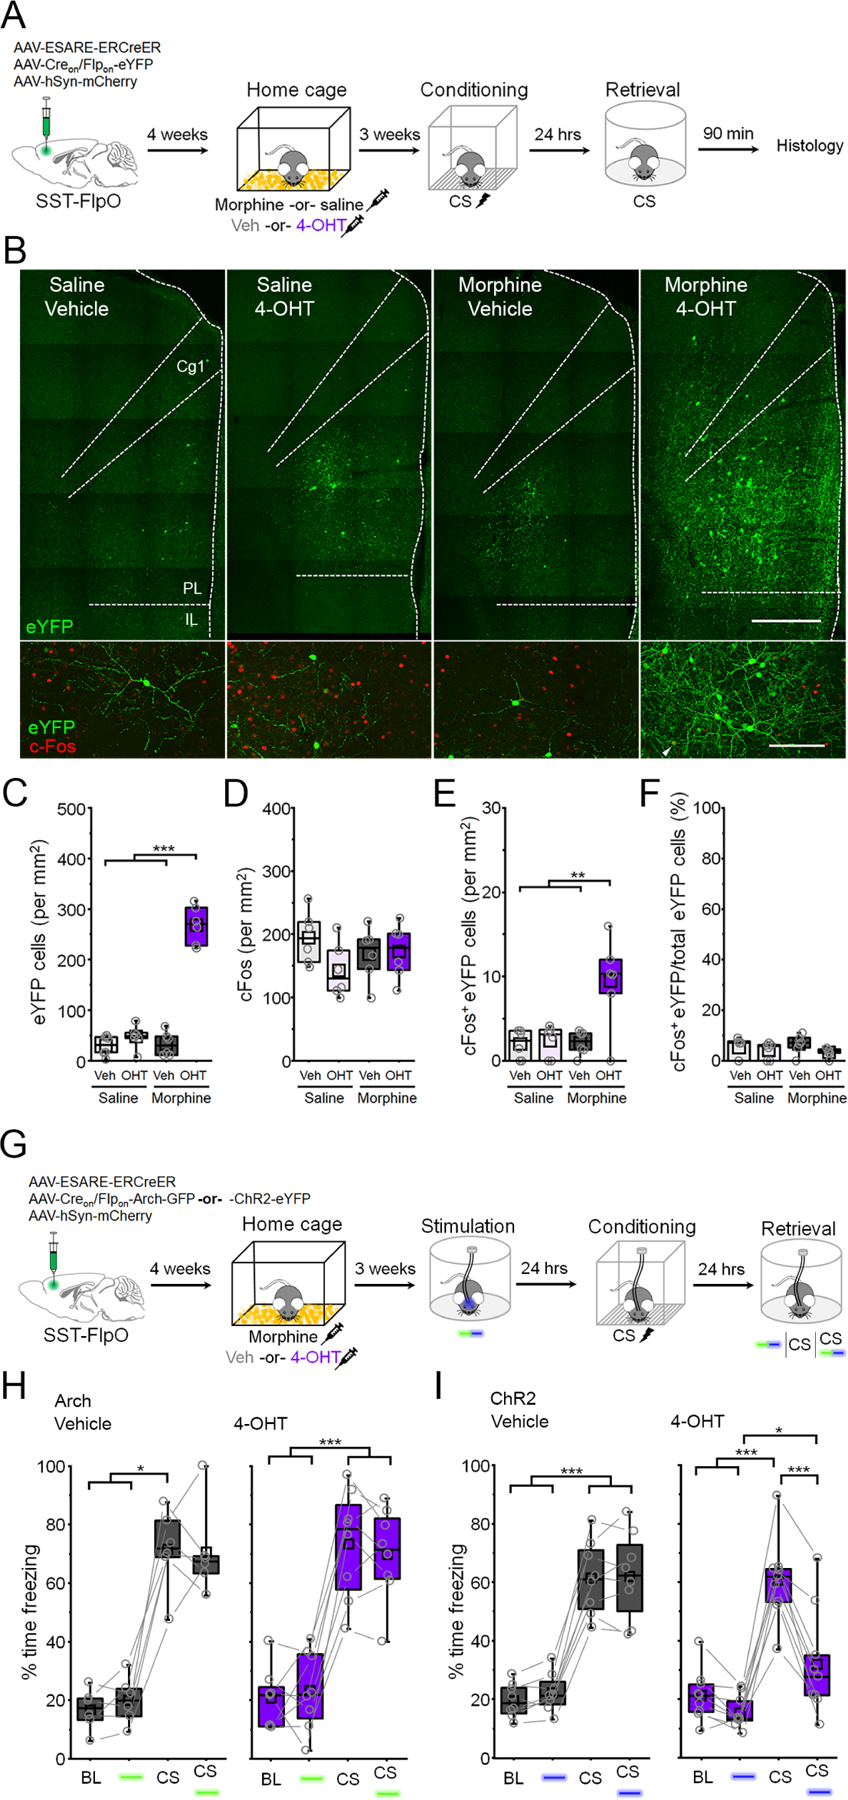
Figure 5: Morphine activates an orthogonal population of somatostatin-interneurons that opposes conditioned fear expression.

(A) Timeline for tagging of morphine-related SST-INs followed by fear conditioning and cFos analysis of retrieval-dependent reactivation. (B) Top: representative SST-IN tagging. Scale bar = 500 µm. Bottom: cFos induction following memory retrieval. White arrowhead denotes cFos+ eYFP neuron. Scale bar = 100 µm. Cg1 = cingulate area 1. PL = prelimbic cortex. IL = infralimbic cortex. (C-F) Boxplot comparison between saline vehicle (n = 6 mice), tones only 4-OHT (n = 6 mice), conditioning vehicle (n = 6 mice), and conditioning 4-OHT (n = 6 mice) groups of (C) number of eYFP+ cells: F(1,20) = 96.1, p = 4.42 × 10⁻⁹, interaction between drug and treatment, 2-way ANOVA; (D) number of cFos+ cells: F(1,20) = 2.62, p = 0.12, 2-way ANOVA; (E) number of cFos+/eYFP+ double positive cells: F(1,20) = 7.77, p = 0.011, interaction between drug and treatment, 2-way ANOVA; and (F) number of cFos+/eYFP+ double positive cells normalized to the total number of eYFP+ cells in each group: χ2 = 4.95 (3), p = 0.175, Kruskal-Wallis ANOVA. (G) Timeline for tagging of morphine-related SST-INs followed by optogenetic analysis of fear behavior. (H) Boxplots depict modulation of freezing by photoinhibition (532 nm, 20 s epochs, constant) and CS presentation during the retrieval test for vehicle (gray) and 4-OHT (purple) mice. Vehicle: χ2 = 14.6 (3), p = 0.0022, Friedman ANOVA. 4-OHT: F(3,21) = 66.4, p = 6.99 × 10⁻¹¹, 1-way repeated measures ANOVA. (I) Boxplots depict modulation of freezing by photoexcitation (473 nm, 20 s epochs, 20 Hz, 5 s pulses) and CS presentation during the retrieval test for vehicle (gray) and 4-OHT (purple) mice. Group x stimulus interaction: F(3,21) = 41.6, p = 5.11 × 10⁻⁹, 2-way repeated measures ANOVA. * p < 0.05, ** p < 0.01, *** p < 0.001 by Tukey’s post-hoc test (C, E, H, I) or Dunn’s post-hoc test (F, H). See also Figure S7.
