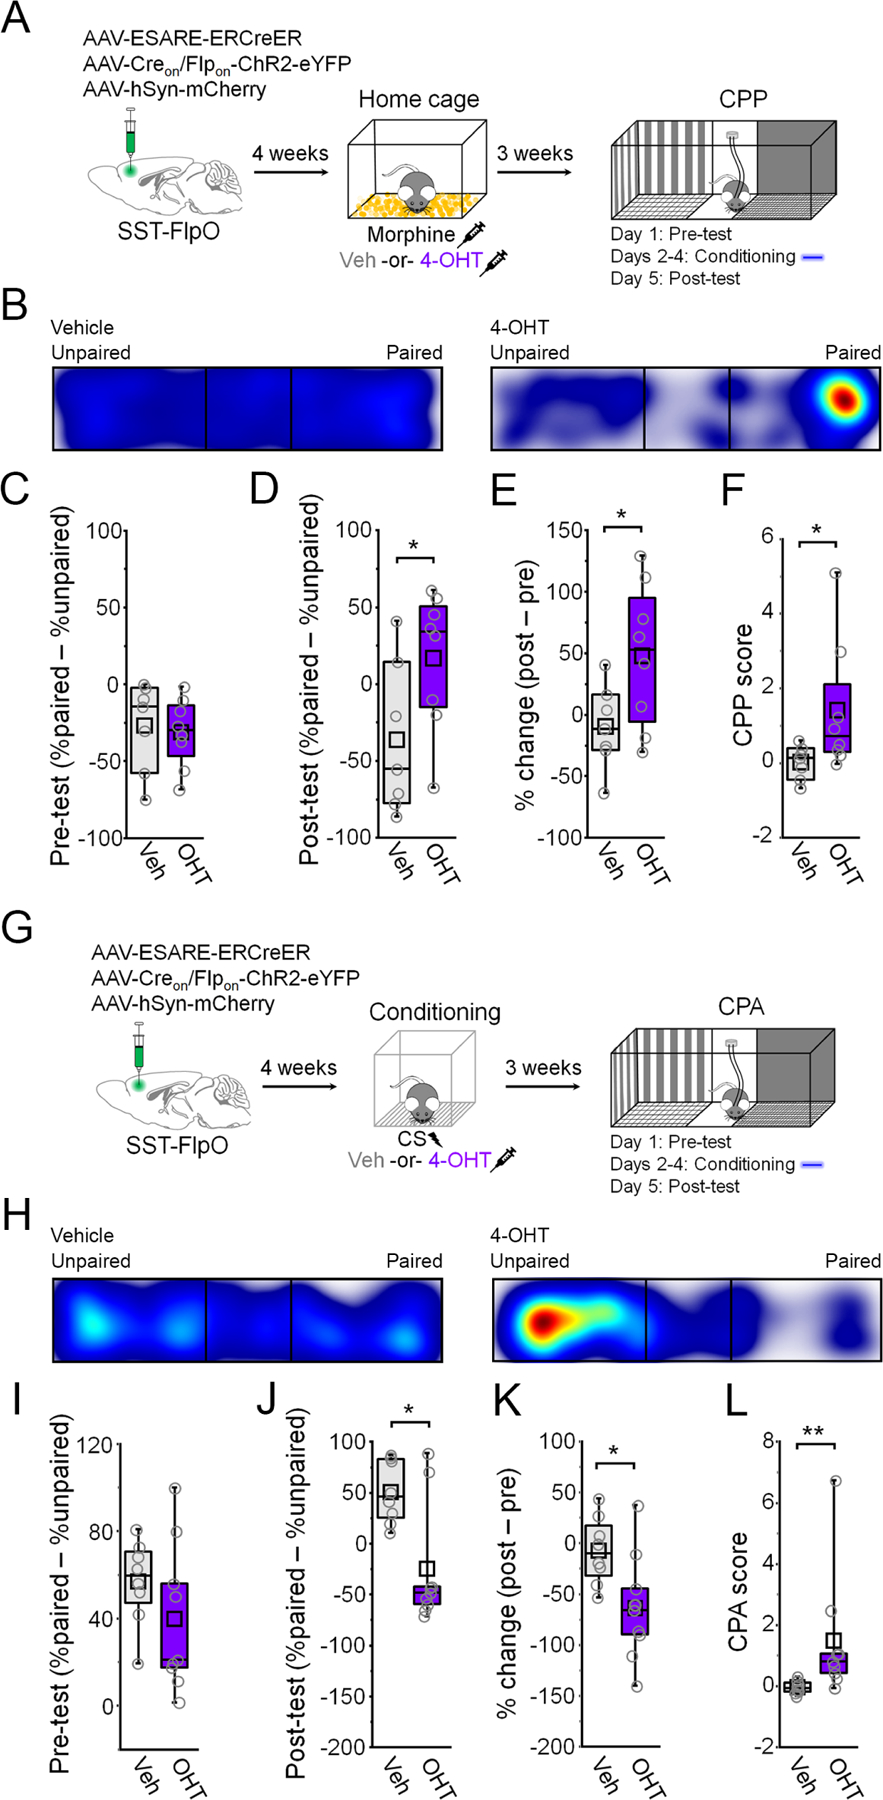
Figure 6: Morphine and fear-related SST-INs signal opposite valence.

(A) Timeline for tagging and photoexcitation of morphine-related SST-INs in a CPP assay. (B) Example heat maps for the post-conditioning test. (C) Boxplot of pre-conditioning place preference: t13 = 0.32, p = 0.75, two-sided unpaired t-test. (D) Boxplot of post-conditioning place preference: t13 = 2.19, p = 0.047, two-sided unpaired t-test. (E) Boxplot of percent change in preference: t13 = 2.27, p = 0.041, two-sided unpaired t-test. (F) CPP score: U = 10, p = 0.043, Mann-Whitney U-test. (G) Timeline for tagging and photoexcitation of fear-related SST-INs in a CPA assay. (H) Example heat maps during the post-conditioning test of place aversion. (I) Boxplot of pre-conditioning place preference: : t15 = 1.26, p = 0.22, two-sided unpaired t-test. (J) Boxplot of post-conditioning place preference: U = 59, p = 0.031, Mann-Whitney U-test. (K) Boxplot of percent change in preference: t15 = 2.57, p = 0.021, two-sided unpaired t-test. (L) CPA score: U = 5, p = 0.0033, Mann-Whitney U-test. * p < 0.05, ** p < 0.01 by unpaired t-test (D, E, K) or Mann-Whitney U test (F, J, L).
