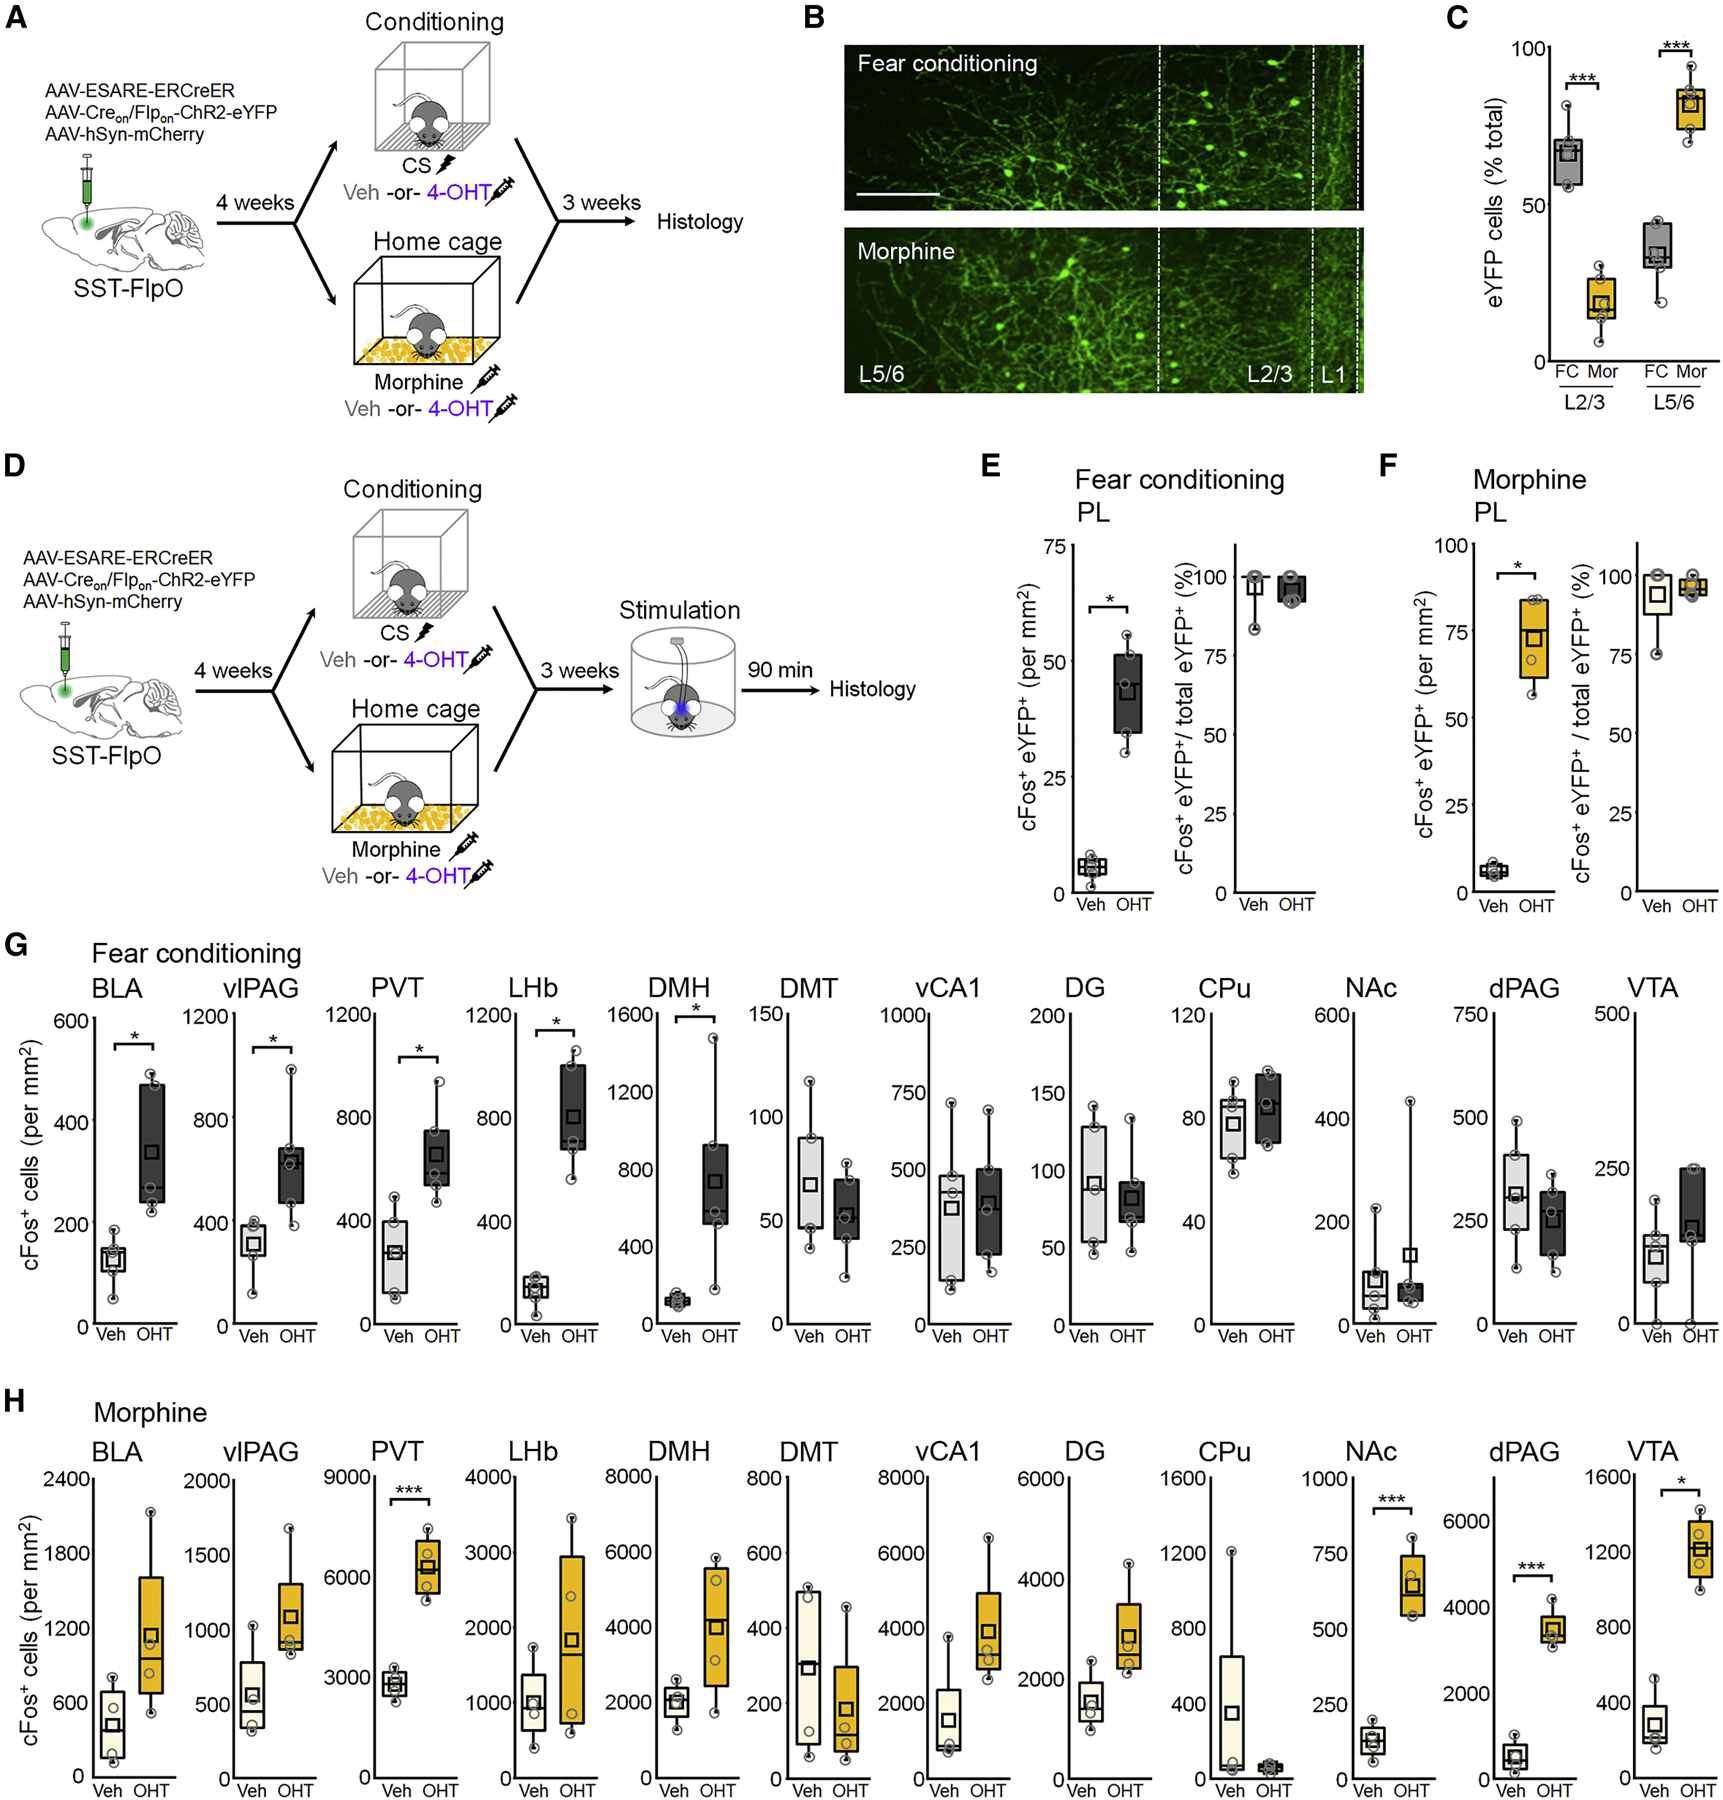
Figure 7: Fear- and morphine-related SST-INs differ in laminar distribution and modulate distinct brain networks.

(A) Timeline for cellular tagging followed by lamina-specific cell counts. (B) Representative eYFP tagging. Scale = 100 µm. (C) Boxplot of proportion of eYFP+ cells in L2/3 versus L5/6. F(1,20) = 160, p = 5.20 × 10⁻¹¹, 2-way ANOVA. (D) Timeline for cFos-based analysis of network activity following photoexcitation of fear- or morphine-related SST-INs. (E-F) Boxplots depict density of tagged SST-INs exhibiting cFos expression following fear conditioning (E) or morphine (F). (E) Density of cFos+ tagged SST-INs: U = 0, p = 0.012, Mann-Whitney U test. (F) Density of cFos+ tagged SST-INs: U = 0, p = 0.030, Mann-Whitney U test. (G-H) Boxplot comparison of cFos+ cells within indicated brain regions after photoexcitation by t-test or Mann-Whitney U test, corrected for a false discovery rate of 0.1 by the Benjamini-Hochberg method. Basolateral amygdala, BLA; ventrolateral periaqueductal gray, vlPAG; paraventricular thalamus, PVT; lateral habenula, LHb; dorsomedial hypothalamus, DMH; dorsal midline thalamus, DMT; ventral hippocampus area CA1, vCA1; dorsal hippocampus dentate gyrus, DG; caudate putamen, CPu; nucleus accumbens, NAc; dorsal PAG, dPAG; ventral tegmental area, VTA. (G) BLA: t8 = 3.34, p = 0.010; vlPAG: t8 = 2.72, p = 0.026; PVT: t8 = 3.34, p = 0.010; LHb: U = 0, p = 0.012; DMH: U = 0, p = 0.012; DMT: t8 = 0.80, p = 0.45; vCA1: t8 = 0.11, p = 0.92; DG: t8 = 0.39, p = 0.71; CPu: t8 = 0.69, p = 0.51; NAc: U = 10, p = 0.68; dPAG: t8 = 0.83, p = 0.43; VTA: t8 = 0.84, p = 0.42. (H) BLA: t6 = 1.87, p = 0.11; U = 3, p = 0.19; vlPAG: t6 = 2.72, p = 0.026; PVT: t6 = 6.56, p = 5.99 × 10⁻⁴; LHb: t6 = 1.15, p = 0.30; DMH: t6 = 2.00, p = 0.092; DMT: t6 = 0.73, p = 0.49; vCA1: U = 3, p = 0.19; DG: t6 = 2.25, p = 0.065; CPu: U = 10, p = 0.66; NAc: t6 = 7.42, p = 3.08 × 10⁻⁴; dPAG: t6 = 9.46, p = 7.95 × 10⁻⁵; VTA: U = 0, p = 0.029. * p < 0.05, ** p < 0.01, ***p < 0.001 by Tukey’s post-hoc (C), Mann-Whitney U test (E-H), or unpaired two-sided t-test (G-H).
