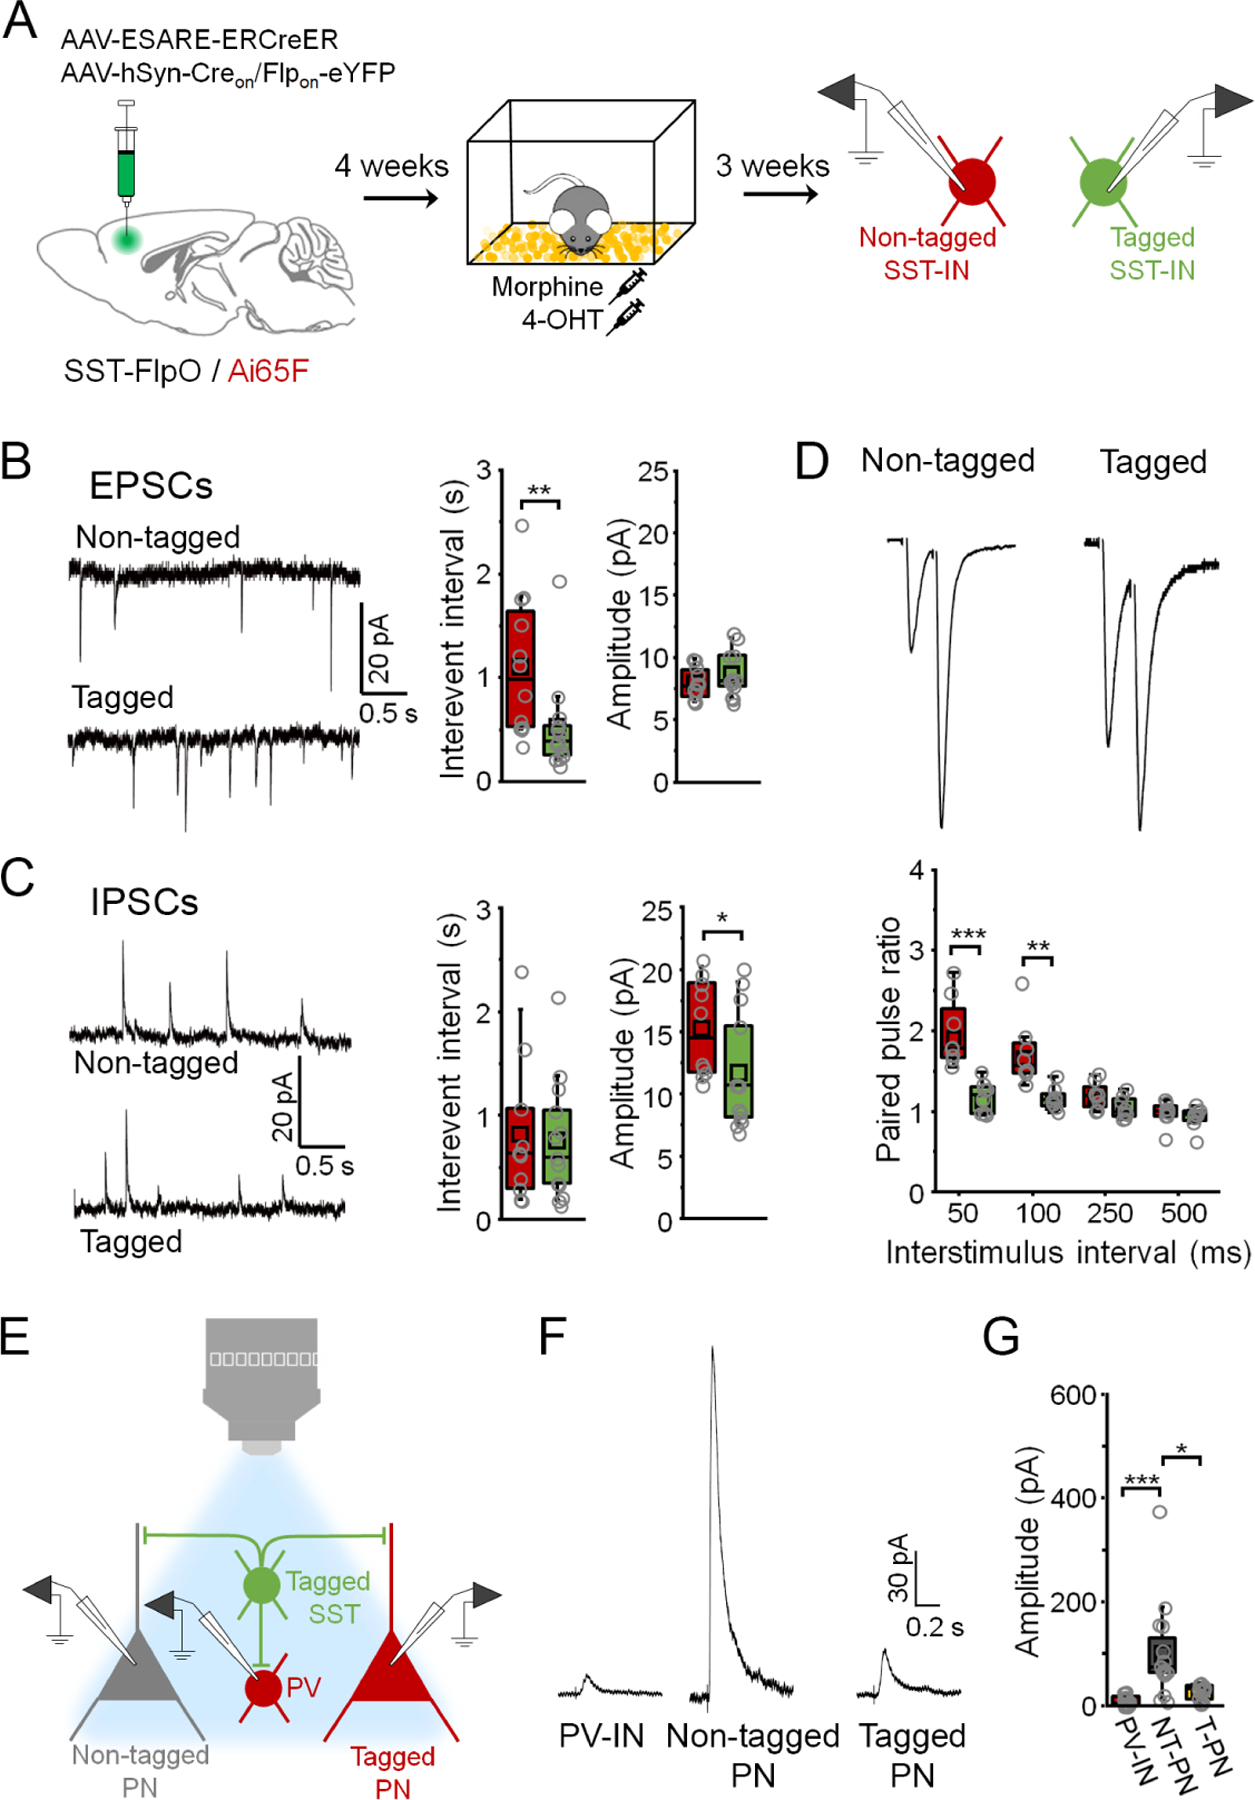
Figure 8. Synaptic connections formed by morphine-related SST-INs have distinct properties.

(A) Strategy for independent targeting of activated (eYFP+/ tdTomato+) versus nonactivated SST-INs (eYFP-/ tdTomato+) for electrophysiological recording following morphine treatment. (B) Boxplots depict spontaneous EPSC parameters from tagged (n = 13 cells) and non-tagged SST-INs (n = 12 cells) in the same slices (n = 4 slices from 4 mice). Interevent interval: U = 126, p = 0.0010, Mann-Whitney U-test. Amplitude: t28 = −1.03, p = 0.31, two-sided unpaired t-test. (C) Boxplots depict spontaneous IPSC parameters from tagged (n = 13 cells) and non-tagged SST-INs (n = 10 cells) in the same slices (n = 4 slices from 4 mice). Interevent interval: U = 89, p = 0.70, Mann-Whitney U-test. Amplitude: t26 = 0.945, p = 0.353, Mann-Whitney U-test. (D) Boxplots depict amplitude of EPSCs from tagged (n = 8 cells) and non-tagged SST-INs (n = 8 cells) in the same slices (n = 3 slices from 3 mice) during paired pulse stimulation. Paired pulse ratio: F(3,21) = 11.2, p = 1.36 × 10⁻⁴, interaction between cell type and delay, 2-way repeated measures ANOVA. (E) Strategy for electrophysiological analysis of connections from tagged SST-INs onto PV-INs (tdTomato+) as well as tagged (tdTomato+) and non-tagged PNs (tdTomato-) following morphine treatment. (F) Example IPSC traces. (G) Boxplots depict amplitude of IPSCs resulting from photoexcitation (460 nm, 1 ms, 0.1 Hz) of tagged SST-INs in PV-INs, non-tagged PNs (NT-PNs), and tagged PNs (T-PNs) following morphine treatment (n = 4 slices from 4 mice: PV-INs (n = 15 cells), NT-PNs (n = 16 cells), T-PNs (n = 12 cells)). χ2 = 23.6 (2), p = 7.38 × 10⁻⁶, Kruskal-Wallis ANOVA. * p < 0.05, ** p < 0.01, *** p < 0.001 by Mann-Whitney U test (B, C), Tukey’s post-hoc test (D), or Dunn’s post-hoc test (G). See also Figure S8.
