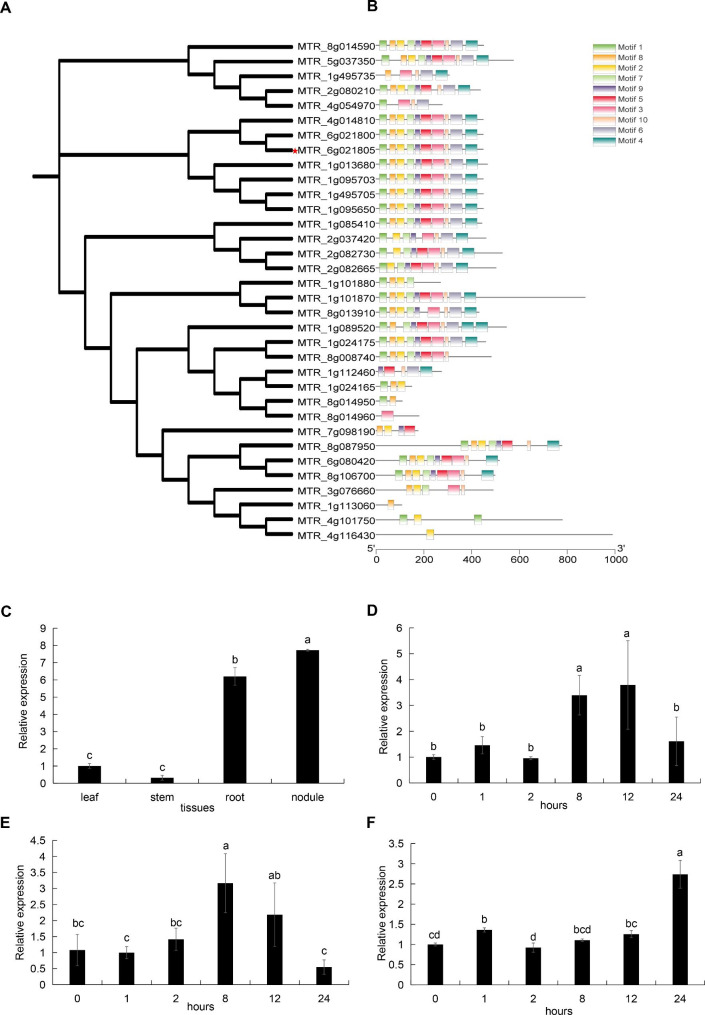
Fig. 1.
Bioinformatic analyses of EF genes in M. truncatula and expression pattern of MtEF1A1. (A) Phylogenetic tree shows the relationships between the 34 EF gene family members in M. truncatula. MtEF1A (MTR_6g021805) is marked by a red pentagram. (B) Analysis of conserved motifs in EF family proteins. The conserved motifs 1–10 were indicated by different colors. (C) Expression levels of MtEF1A1 of different tissues in wild-type M. truncatula (R108) and expression levels were normalized to leaf. Different lowercase letters indicate significant differences (p < 0.05). Differential expression of MtEF1A1 in response to 200 mM NaCl for 0, 1, 2, 8, 12, 24 h in M. truncatula R108 of leaf (D), stem (E) and root (F). Each tissues expression level in salt-treated was normalized to that of plants at point 0 h. Values are means ± SD of three biological replicates. Different lowercase letters indicate significant differences (p < 0.05)

