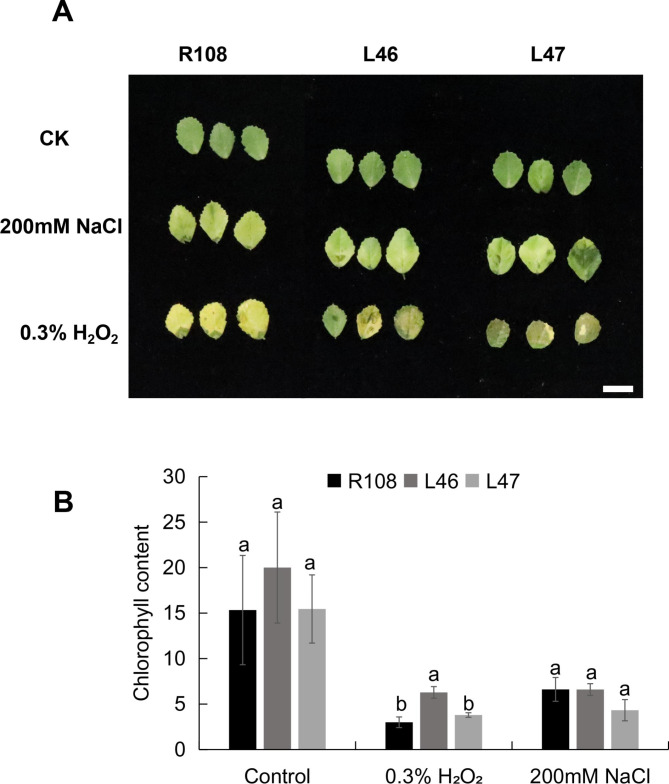
Fig. 5.
Leaf phenotypes of wild-type (WT) and MtEF1A1-overexpression (OE) M. truncatula lines treated with salt or H2O2. (A) Leaf phenotypes of WT (R108) and MtEF1A1-OE plants (L46 and L47). Plants were treated with 200 mM salt or 0.3% H2O2. Scale bar = 1 cm. CK, control (0 mM NaCl). (B) Leaf chlorophyll content in R108, L46 and L47 plants after salt or H2O2 treatment. Values are means ± SD of three biological replicates. Different lowercase letters between different OE lines of one treatment indicate significant differences within each treatment (p < 0.05)

