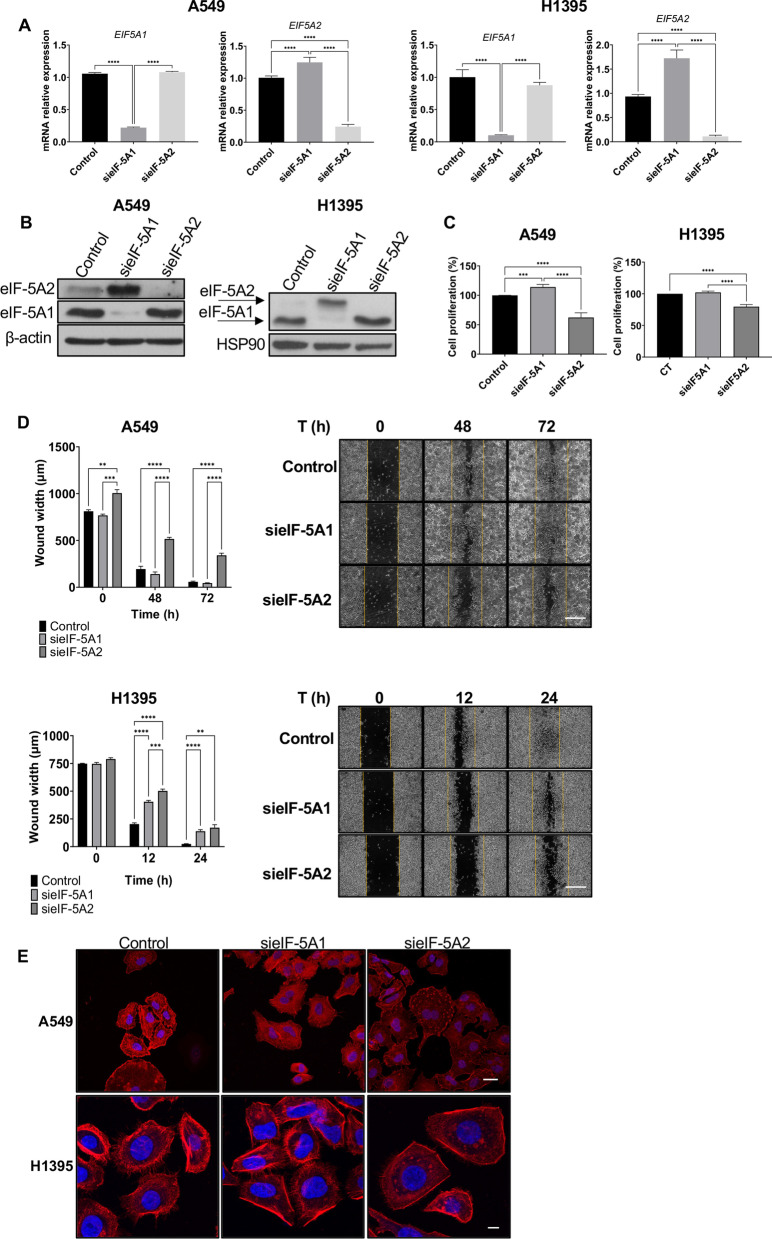
Fig. 2.
Differential contribution of eIF-5A1 and eIF5-A2 to cell proliferation and migration. A A549 and H1395 cells were transfected with either a control siRNA (Control) or EIF5A1- and EIF5A2-specific siRNAs (siEIF5A1 and siEIF5A2) for 72 h. The mRNA expression was analyzed by RT-qPCR. Experimental means (n = 3 with experimental triplicates) were compared by two-way ANOVA analysis with Tukey's test for multiple comparison of samples (***p < 0.001, ****p < 0.0001). B eIF-5A1 and eIF-5A2 protein levels upon transfection of siRNA. eIF-5A1 and eIF-5A2 proteins levels were assayed by immunoblotting in A549 and H1395 cells processed as in (A). b-Actin or HSP90 were used as a loading control. A representative image of the experiments performed is shown (N = 3). C Cell proliferation was assayed using the MTS assay upon siEIF5A1 and siEIF5A2 transfection. Experimental means (n = 6 with experimental triplicates) were compared by two-way ANOVA with Tukey's test for multiple sample comparison (***p < 0.001, ****p < 0.0001).) D Analysis of cell migration in siRNA EIF5A1 or siRNA EIF5A2 transfected cells. Wound closure was performed 96 h after trasnfection and cell migration was monitored by phase-contrast microscopy. The means of the experiments (n = 3 with experimental triplicates) were compared by two-way ANOVA analysis with Tukey's test for multiple comparison of samples (**p < 0.01, ***p < 0.001, ****p < 0.0001) (left panel). Phase constrast representatives images. Scale bar 500 µm. E Genetic inhibition of EIF5A1 and EIF5A2 alters the organization of the F-actin citoeskeleton. Representative fluorescence microscopy images of A549 and H1395 cells transfected with siEIF5A1 and siEIF5A2 for 72 h. F-actin cytoskeleton was stained with rhodamine phalloidin (red). Dapi staining (blue) was used to visualised the nuclei. Scale bar of A549 fluorescence images 25 µm; scale bar of H1395 fluorescence images 10 µm

