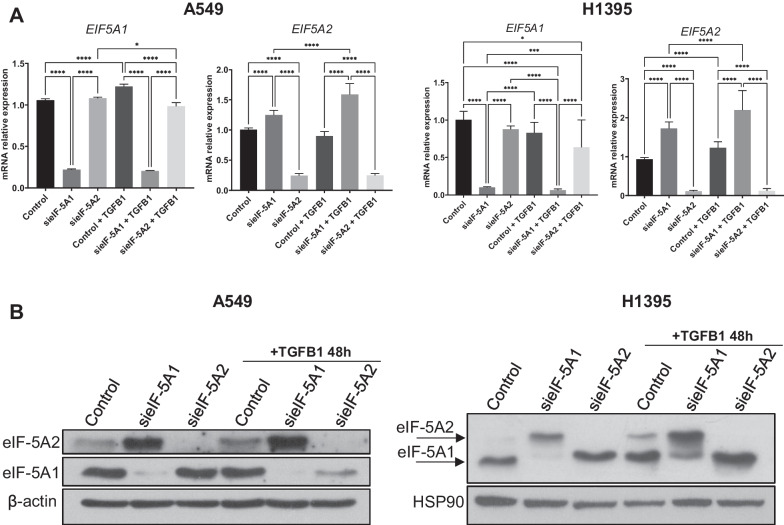
Fig. 4.
TGFB1 induces eIF-5A2 protein expression. A EIF5A1 and EIF5A2 mRNA levels in A549 and H1395 cells treated with TGFB1. Cells were transfected with siEIF5A1, siEIF5A2 or siCT for 72 h and treated or not with TGFβ1 for 48 h. The mRNA relative expression was analyzed by RT-qPCR. Experimental means (n = 3 with experimental triplicates) were compared by two-way ANOVA analysis with Tukey's test for multiple comparison of samples (*p < 0.05, **p < 0.01, ****p < 0.0001). B eIF-5A2 and eIF-5A1 protein levels of cells in A were analised by western blot. β-Actin or HSP90 were used as a loading control. A representative image of the experiments performed is shown (n = 3)

