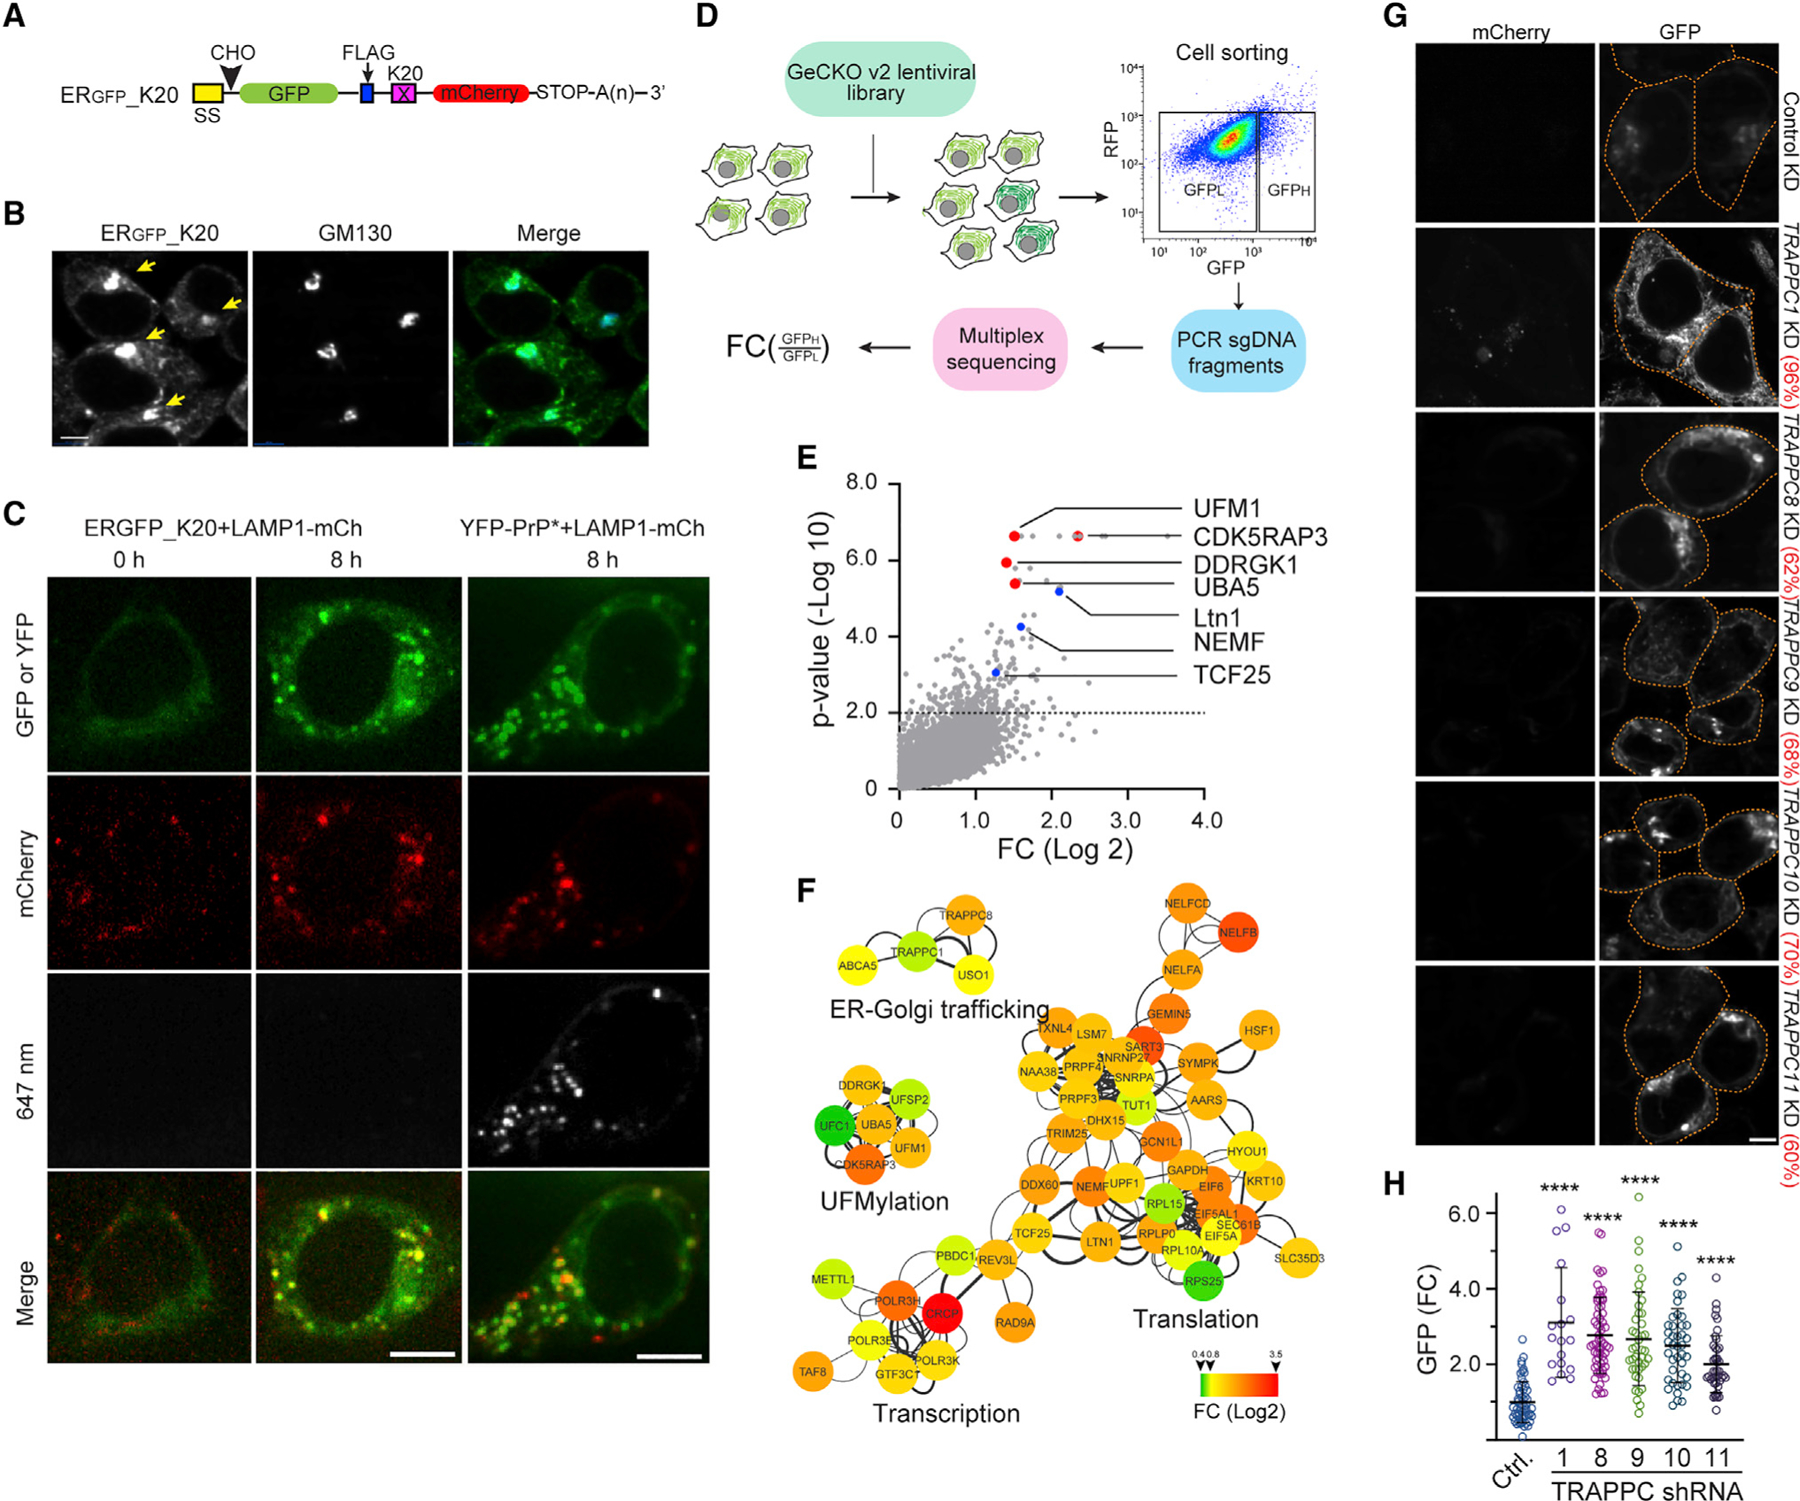
Figure 1. ERGFP_K20 is transported to lysosome via the Golgi by the TRAPP complex.

(A) A schematic diagram of the model TAQC substrate. SS, signal sequence; CHO, N-glycosylation site; X = K20.
(B) ERGFP_K20 is exported to lysosomes via the Golgi. ERGFP_K20-expressing 293T cells were treated with bafilomycin A1 (Baf A1) (200 nM), fixed, and stained by GM130 antibodies (blue). Arrows indicate Golgi-localized ERGFP_K20. Scale bar, 5 μm.
(C) Representative images from time-lapse videos show that ERGFP_K20 and YFP-PrP* are transported to lysosomes via distinct routes. ERGFP_K20 stable cells transfected with LAMP1-mCherry (mCh) were imaged at the indicated time points after treatment with Baf A1 and Alexa647-labeled GFP antibodies (left panels). The right panels show cells transfected with YFP-PrP* and LAMP1-mCh as a control. Scale bar, 5 μm.
(D) A schematic diagram of the CRISPR-Cas9 screen. LFC, log fold change.
(E) A scatterplot shows the distribution of genes positively enriched in ERGFP_K20 high cells. The dotted line indicates p = 0.01. Note that sgRNAs targeting the UFM1 pathway are enriched.
(F) A Cytoscape gene interaction map for sgRNAs positively enriched in ERGFP_K20-high cells. The color key indicates fold change (FC) in log 2.
(G and H) Knockdown of TRAPPC genes causes ERGFP_K20 accumulation in cells.
(G) Representative confocal images showing ERGFP_K20 stable cells transfected with the indicated shRNA constructs. The numbers indicate average knockdown efficiency determined by qRT-PCR (n = 3). Scale bar, 5 μm.
(H) The graphs show the quantification of GFP fluorescence in individual cells. Error bars indicate means ± SD; ****p < 0.0001 by one-way ANOVA with Dunnett’s multiple comparisons test. n = 3 independent experiments.
