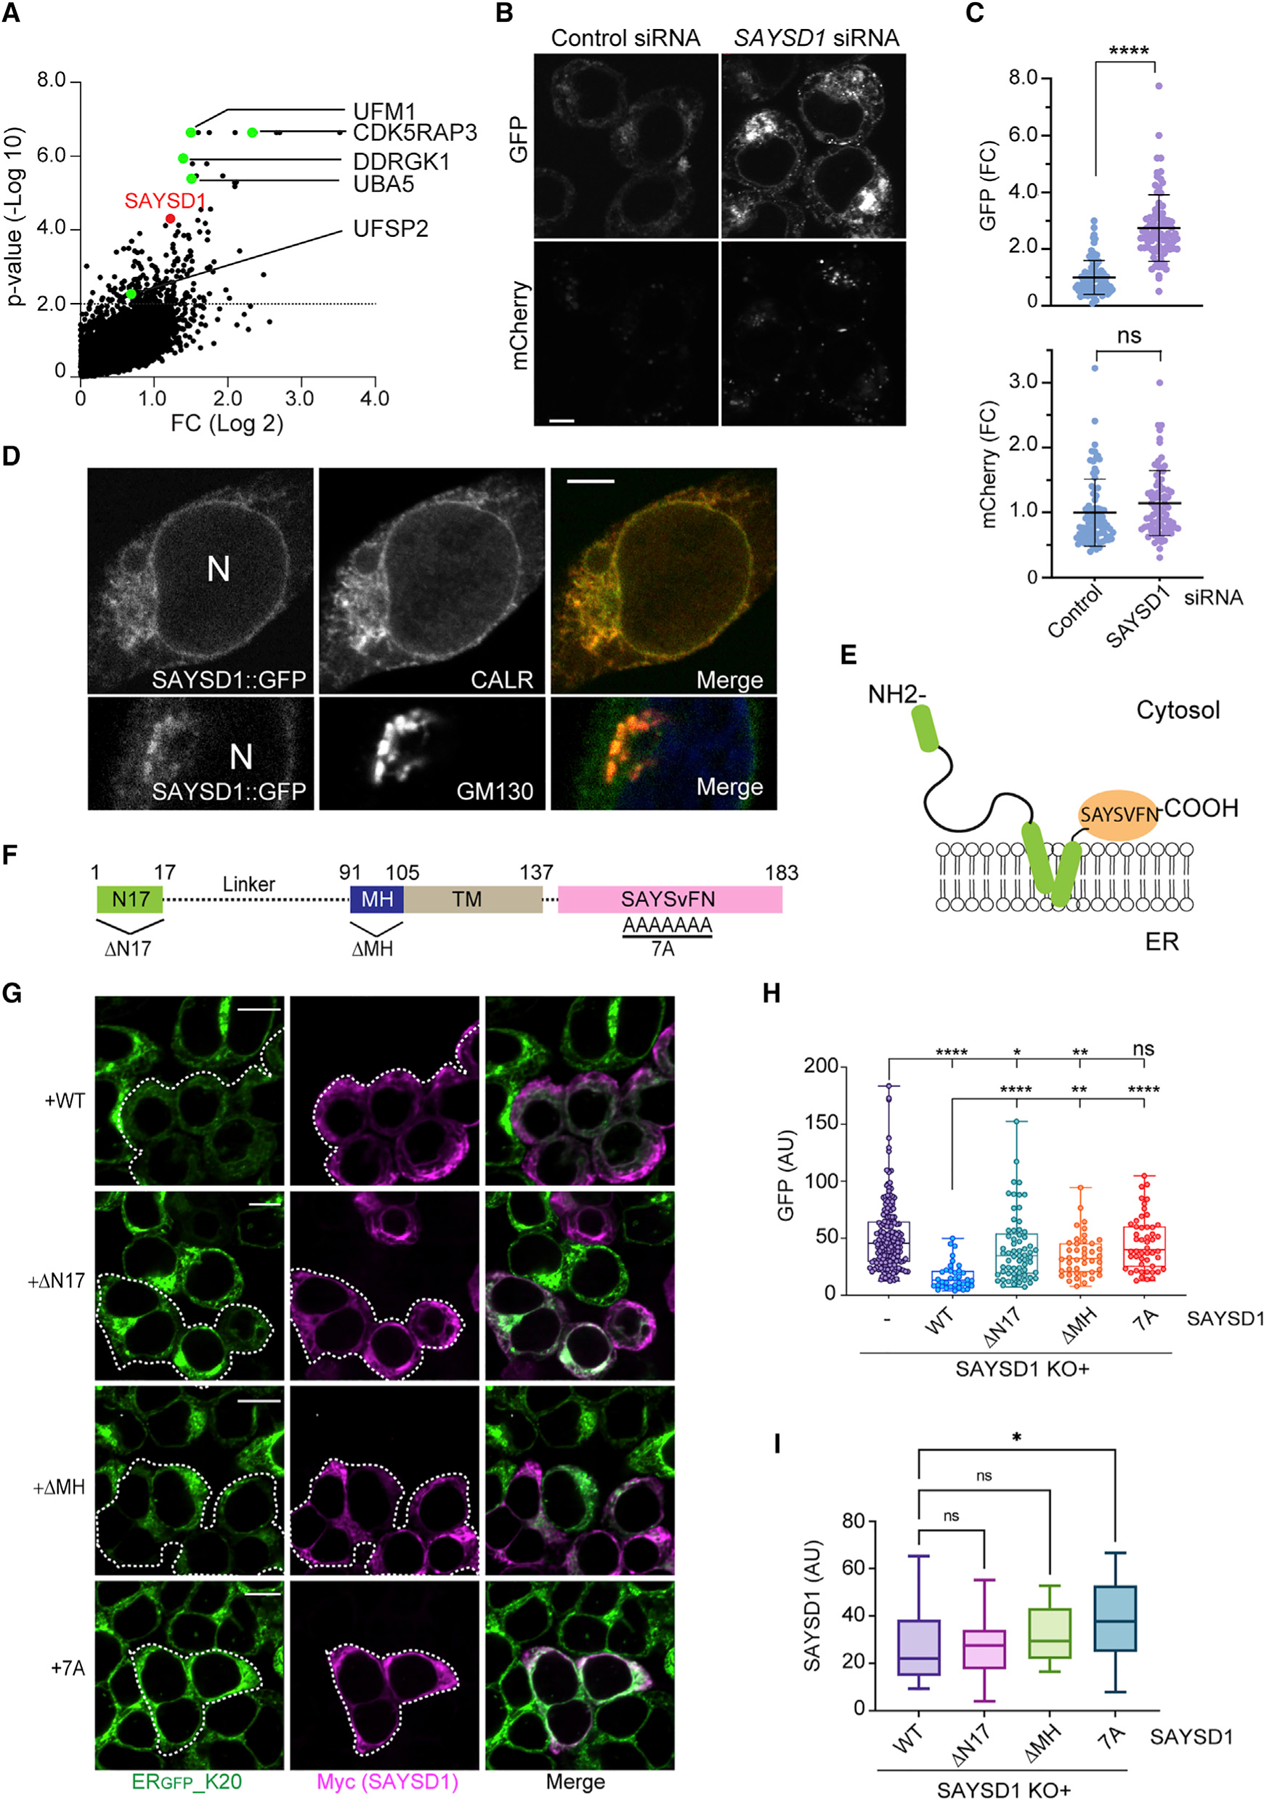
Figure 2. SAYSD1 promotes the degradation of ERGFP_K20.

(A) sgRNAs targeting SAYSD1 are enriched in ERGFP_K20-high cells. The UFM1 pathway genes were highlighted in green.
(B and C) Knockdown of SAYSD1 increases the ERGFP_K20 green fluorescence without affecting the full-length readthrough product. (B) Shown are ERGFP_K20 stable 293T cells transfected with control or SAYSD1 siRNA for 48 h. Scale bar, 5 μm. The graphs in (C) show the quantification of the GFP and mC fluorescence in individual cells, respectively. Error bars indicate means ± SD, ****p < 0.0001 by unpaired Student’s t test; ns, not significant. n = 3 independent experiments.
(D) SAYSD1 is mainly localized to the ER. 293T cells expressing GFP-tagged SAYSD1 from the endogenous locus were fixed and stained with GM130 (bottom panels) or calreticulin (top panels) antibodies. N, nucleus. Scale bar, 5 μm.
(E) The predicted membrane topology of SAYSD1.
(F) The domain structure of SAYSD1 and the mutants used in the rescue study.
(G–I) Expression of Myc-tagged wild-type (WT) SAYSD1 but not mutants lacking either the SAYSVFN motif (7A), the N-terminal 17 residues (ΔN17), or the middle helical segment (ΔMH) in SAYSD1 knockout (KO) cells restores the degradation of ERGFP_K20. (G) Representative images from the experiments. Dashed lines indicate SAYSD1-positive cells. Scale bars, 10 μm. The graph in (H) shows the quantification of GFP fluorescence in individual cells. Error bars indicate means ± SD; ****p < 0.0001, **p < 0.01, *p < 0.05 by one-way ANVOA. ns, not significant. n = 4 independent experiments. (I) Quantification of SAYSD1 expression in (G).
