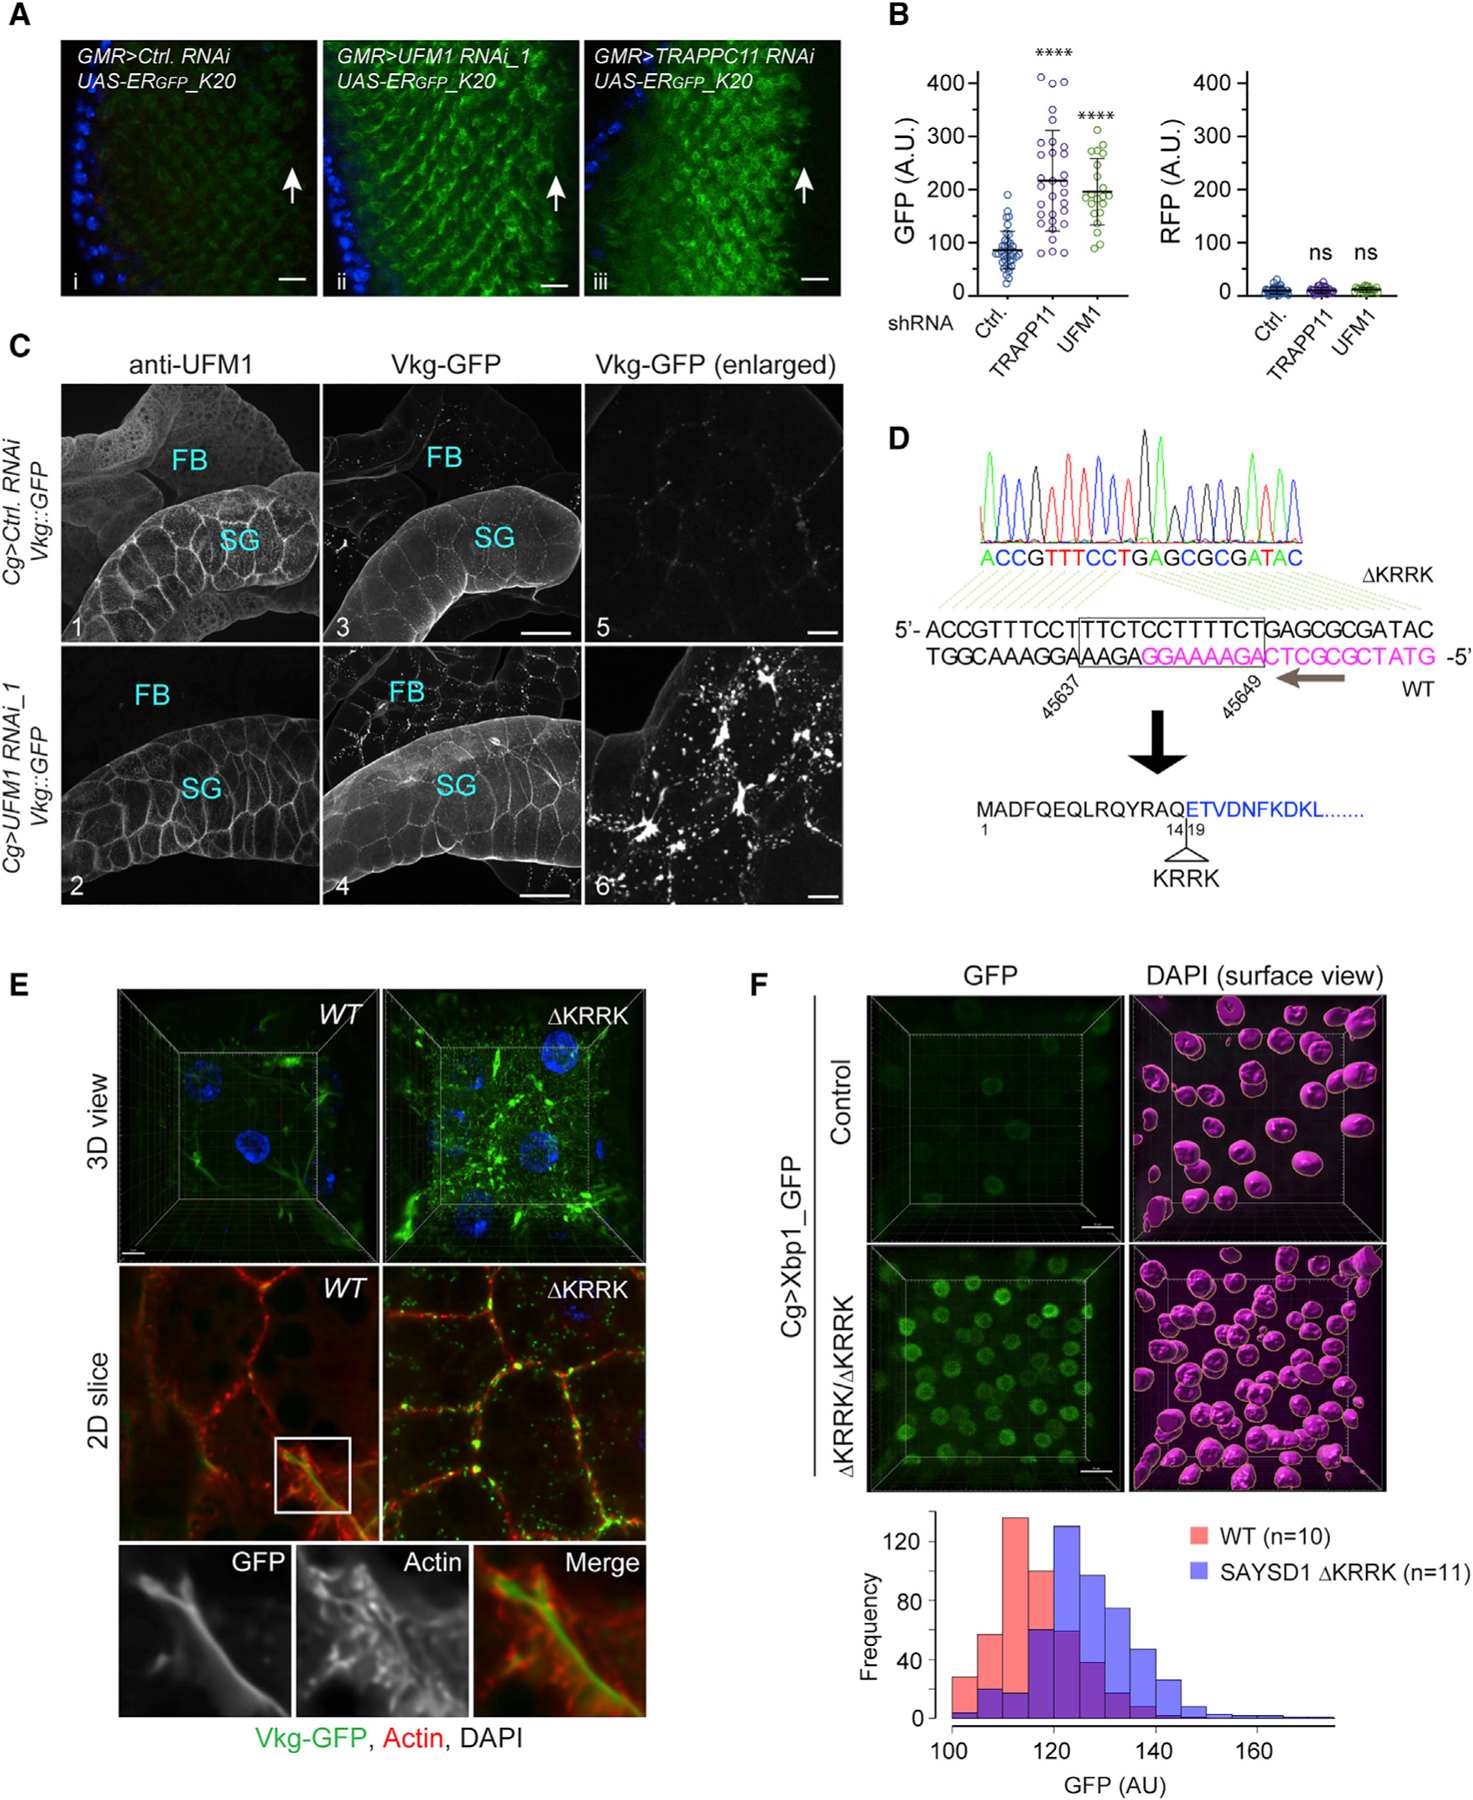
Figure 6. UFMylation and SAYSD1 regulate TAQC and ER protein biogenesis in Drosophila.

(A) Knockdown of UFM1 or TRAPPC11 in photoreceptor cells caused accumulation of ERGFP_K20. Scale bars, 10 μm.
(B) Quantification of the fluorescence intensity in individual eye discs as shown in (A). Error bars indicate means ± SD. ****p < 0.001 by one-way ANOVA with Dunnett’s multiple comparisons test. ns, not significant. n = 4 independent experiments.
(C) Fat body (FB) specific knockdown of UFM1 causes Viking-GFP (Vkg-GFP) to accumulate in FBs. Salivary gland (SG)-associated FBs from larvae of the indicated genotypes were stained with UFM1 antibodies (panels 1 and 2). Shown are maximum projected views of the confocal sections. Panels 5 and 6 show an enlarged view of Vkg-GFP in FBs. Scale bars, panels 1–4, 100 μm; panels 5 and 6, 20 μm.
(D) DNA sequencing to validate the genotype of SAYSD1 CRISPR flies. DNA from homozygous SAYSD1 CRISPR second-instar larvae was used to amplify SAYSD1 genomic locus, which was then sequenced. Magenta indicates the sgRNA sequence.
(E) As in (C) except that FBs from second-instar larvae of WT and SAYSD1 homozygous ΔKRRK mutants were stained with an actin dye (red) were imaged. All flies also bear the Vkg:GFP reporter. Scale bar, 10 μm.
(F) ER stress is induced in SAYSD1 ΔKRRK homozygous flies. FBs from control or SAYSD1 ΔKRRK second-instar larvae bearing an ER stress reporter (Xbp1-GFP) were stained with DAPI and imaged by 3D confocal microscopy. 3D surfaces were rendered by Imaris for individual nucleus, which were used to quantify the GFP signal. The graph shows the quantification results from two independent experiments. Scale bar, 15 μm.
