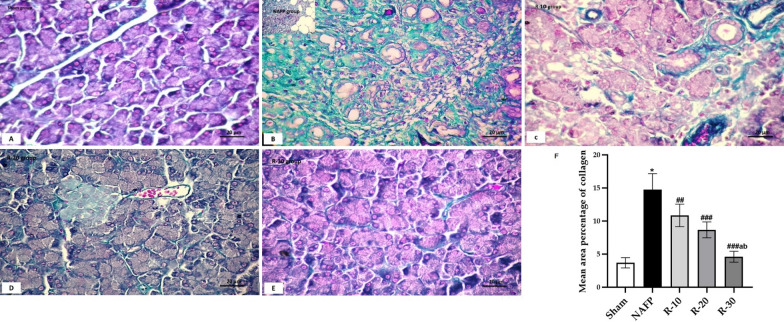
Fig. 3.
Masson trichrome-stained pancreas sections of A; Sham group showed minimal green color of collagen fibers in between the closely packed pancreatic acini, B; NAFP group showed marked green collagen fibers deposition in the interlobular septa and in between the destructed acini, C; R-10 group collagen fibers deposition in the interlobular septa and in between the destructed acini, D; R-20 group showed collagen fibers especially around blood vessels and distorted acini, and E; R-30 group showed mild collagen fibers deposition around acini. [Magnification: 200x]. F The mean area % of collagen deposition (± SD) in the Sham and the experimental groups (n = 6): *P < 0.001 vs the Sham group; ###P < 0.001, and ##P < 0.01 vs NAFP group. aP < 0.05 vs R-10. bP < 0.05 vs R-20. Measurements were taken from three different sections obtained from each animal. Moreover, five haphazardly selected non-overlapping fields were examined for each section

