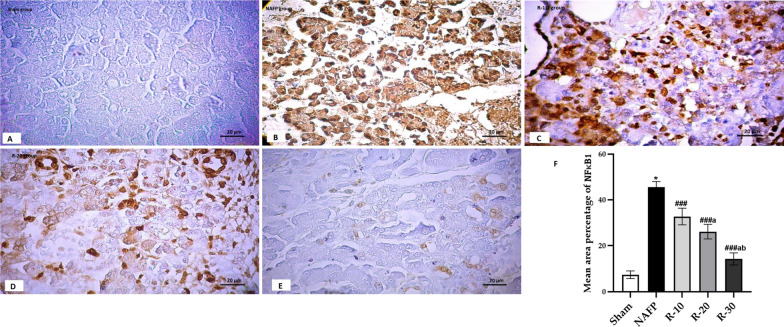
Fig. 6.
A–E NFκB1 immunohistochemistry-stained pancreas sections of A; Sham group showed minimal reaction for NFκB1 among acinar cells, B; NAFP group showed extensive positive reaction for NFκB1, C; R-10 group showed positive obvious reaction for NFκB1 among distorted pancreatic acini, D; R-20 group showed moderate positive reaction for NFκB1 in destructed areas, and E; R-30 group showed minimal positive reaction for NFκB1. [Magnification: 200x]. F; The mean area percentage of NFκB1 positive cells (± SD) in the Sham and the experimental groups (n = 6): *P < 0.001 vs the Sham group; ###P < 0.001 vs NAFP group. aP < 0.05 vs R-10. bP < 0.05 vs R-20

