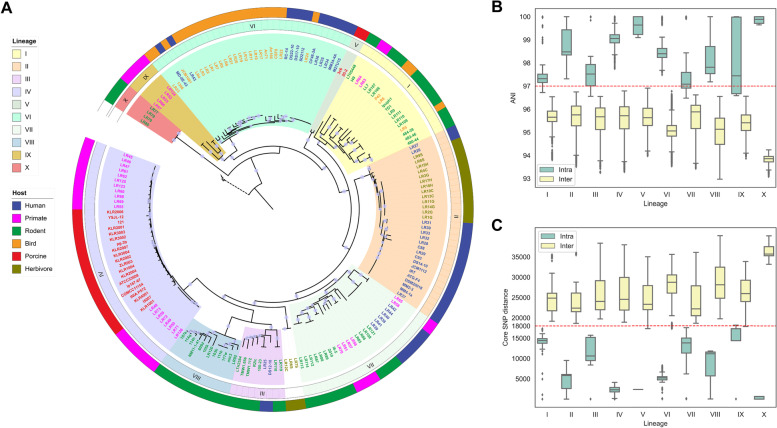
Fig. 1.
Population structure of Limosilactobacillus reuteri. A Maximum likelihood tree of 182 L. reuteri strains based on the core-genome alignment, excluding recombination events. The tree was rooted with L. agrestis, which has a close phylogenetic relationship with L. reuteri [19]. Bootstrap values above 90% are marked as gray dots on the branches. The ten lineages were defined with the population structure analysis using BAPS [25]. Label colors refer to different vertebrate hosts, green for rodent, red for porcine, blue for human, pink for primate except human, yellow for bird, and olive for herbivore. B ANI plot of genome sequence pairs belonging to the same or different lineages. C SNP distance of core-genome pairs. SNP-dists (https://github.com/tseemann/snp-dists) was used to extracted SNP distance from the core-genome alignment that was obtained through Roary [26]. The red dotted lines in B and C separate a majority of intra-lineage values from inter-lineage values

