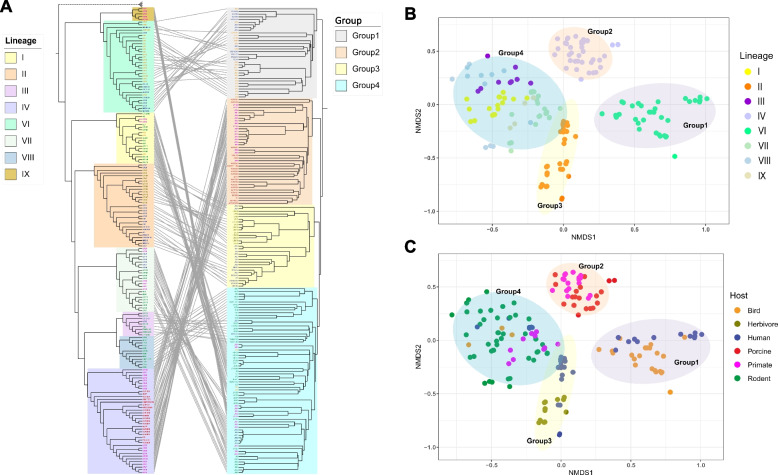
Fig. 2.
Gene content diversity of different lineages. A Juxtaposition of the topologies of the core-genome tree (left) and gene content tree (right). The gene content tree based on Jaccard distance matrix was built by the software MEGA-X using UPGMA method [27]. Core-genome tree was built as described for Fig. 1A. Nonmetric multidimensional scaling (NMDS) ordination based on Jaccard distance of each genome pairs colored by lineages (B) and hosts (C). Four Gene Content Groups were separated based on the Jaccard distance matrix. Ellipses denote 90% confidence intervals. The metaMDS function in the vegan package (https://github.com/vegandevs/vegan) was used to perform NMDS with the stress value of 0.2, and ggplot2 package (https://ggplot2.tidyverse.org) was applied for visualization. Gene Content Group 1 includes lineage VI which comprises isolates from birds and humans, Gene Content Group 2 includes lineage IV which comprises isolates from swine and primates, Gene Content Group 3 includes lineages II which comprises isolates from swine and humans, Gene Count Group 4 includes lineages I, III, VII, VIII, and IX which comprise isolates from rodents, humans, birds, and primates

