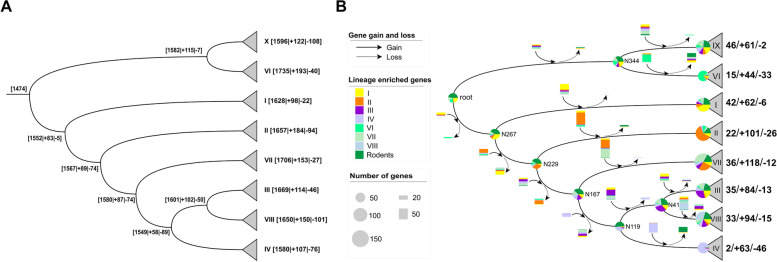
Fig. 4.
Reconstruction of the content of the ancestral genome of L. reuteri. A Gene gain and loss during the evolution of L. reuteri. The numbers in the square brackets represent the estimated ancestral genes, gain (“ + ”) and loss (“ − ”) events, respectively. B Turnover events of lineage-specific genes. Gene families with both sensitivity and specificity above 70% to certain lineage or host predicted by Scoary [33] were included. The gene gain and loss events and the ancestral status of each gene along the tree were inferred by BadiRate [34]. Circles at the end nodes represent the number of lineage-specific genes. Circles on the internal nodes refer to the numbers of estimated ancestral lineage-specific genes. Different colors of the circles represent different lineages, with the distribution of each sector proportionable to the number of genes. The oriented arrows along the tree branches stand for lineage-specific gene flow events, with solid and broken ones for gain and loss respectively. Rectangles along with the arrows represent the number of genes affected, with different color for different lineages. The three numbers at the end of the tips represent the number of genes inherited from the last common ancestor (LCA) of the species, gained during evolution, and lost compared to the LCA

