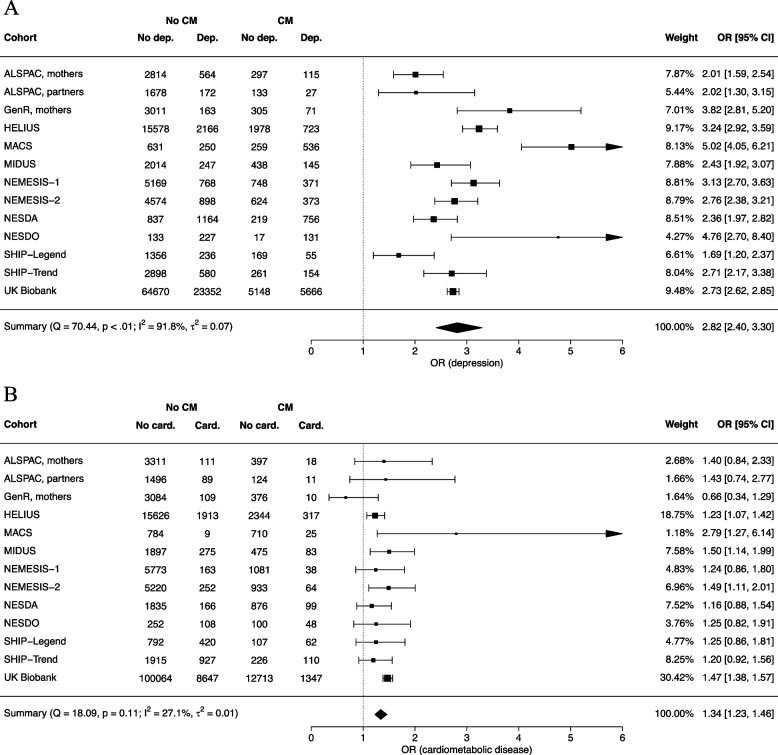
Fig. 1.
Forest plots of the random-effects models of the association of childhood maltreatment with depression (A) and cardiometabolic disease (B). CM, childhood maltreatment. Dep., depression. Card., cardiometabolic disease. OR, odds ratio. CI, confidence interval. Note. Squares represent effect sizes of individual studies. Their size reflects the precision of the estimate based on the random-effect model. The diamond represents the pooled effect size across studies in the center of the diamond, and the lower and upper 95% confidence interval limits at the left and right side of the diamond

