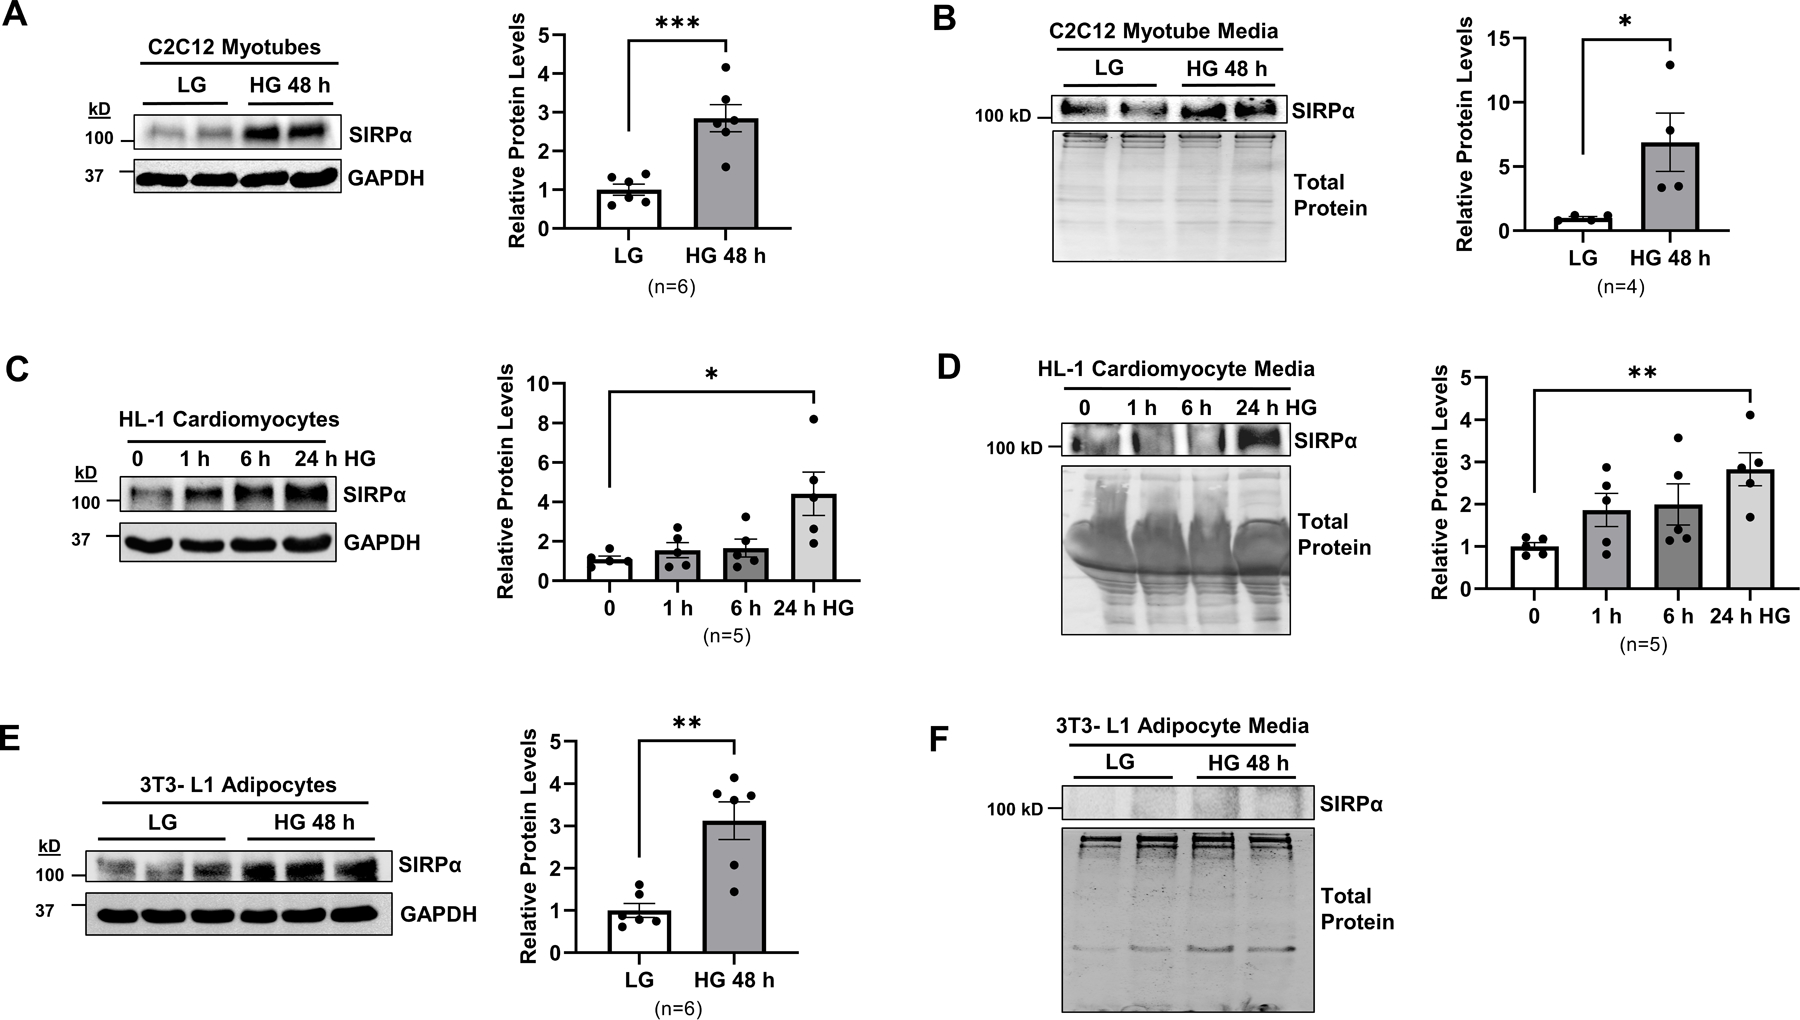
Figure 7. Hyperglycemia induces myocyte release of SIRPα.

(A) C2C12 myotubes cultured in low glucose (LG) media (5 mM) were treated with high glucose (HG) 25 mM for 48 h. Protein lysates were immunoblotted to detect SIRPα and GAPDH and representative immunoblots of averaged data (left panel) with relative levels (right panel) are shown; (B) SIRPα was identified in C2C12 cultured media by immunoblot and representative immunoblots of averaged data (left panel) with relative levels to total protein (right panel) are shown. (C) HL-1 cardiomyocytes were cultured in Claycomb media and treated with high glucose (HG, 90 mM) for 1, 6, 24 h. Protein lysates were immunoblotted to detect SIRPα and GAPDH and representative immunoblots of averaged data (left panel) with relative levels (right panel) are shown; (D) SIRPα was identified in HL-1 cardiomyocyte cultured media and detected by immunoblot and representative immunoblots of averaged data (left panel) with relative levels to total protein (right panel) are shown; (E) 3T3-L1 adipocytes were treated with LG media (5 mM) or HG (25 mM) for 48 h. Protein lysates were immunoblotted to detect SIRPα and GAPDH and representative immunoblots of averaged data (left panel) with relative levels (right panel) are shown; (F) Adipocyte media was immunoblotted to detect SIRPα and total protein and representative immunoblots of averaged data are shown. Statistical significance was calculated using unpaired two-tailed Studen's t-test (A-E). Values are means ± SEM. *p<0.05, ** p<0.01, *** p<0.001.
